Python の Seaborn で相関関係を美しく可視化
変数の Correlation を綺麗に
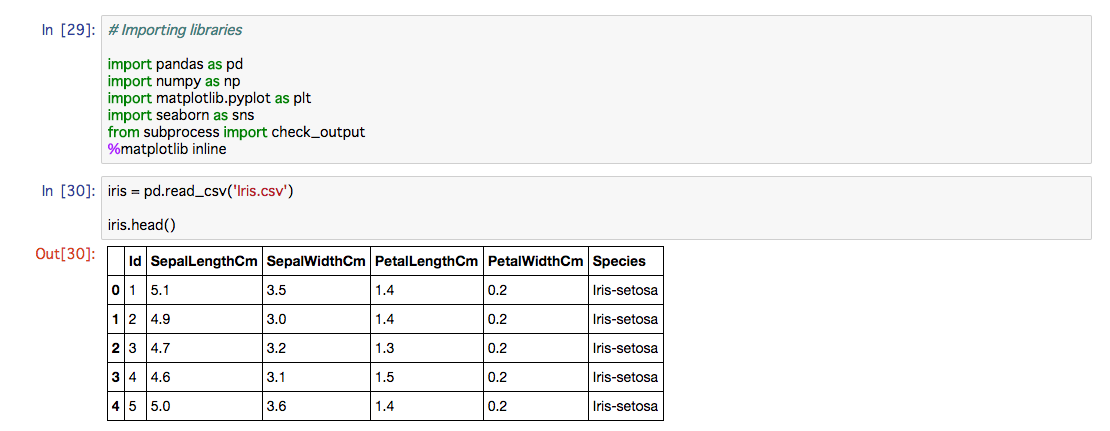
まずpandasやnumpy、seabornなどの必要なライブラリをimportし、今回使うよく知られたデータセットのiris をデータフレームで読み込む。
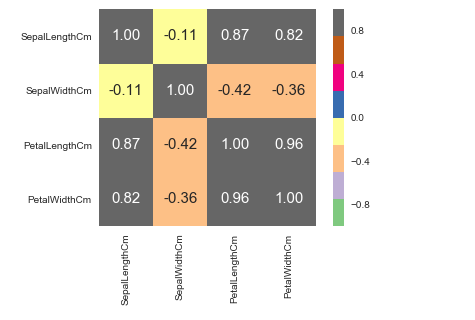
そして、このkeyのSepalLengthCm, SepalWidthCm, PetalLengthCm, PetalWidthCmの相関関係を seaborn の heatmap で可視化。
# correlation between それぞれの変数
cr = ['SepalLengthCm', 'SepalWidthCm', 'PetalLengthCm','PetalWidthCm']
cr_matrix = iris[cr].corr()
heatmap = sns.heatmap(cr_matrix,cbar=True,annot=True,square=True,fmt='.2f',annot_kws={'size': 15},yticklabels=cr,xticklabels=cr,cmap='Accent')
これで相関図ができる。上記の相関図を見てみると PetalLengthCmとPetalWidthCmが高い相関関係にあることがわかる。
下記はheatmap内の変数の意味である。
heatmap 内の変数まとめ
-
cbar
cbarは相関図の右にある数値の大小を示しやすくするために挿入できる棒のこと。Trueで挿入できる。 -
annot
このannotをTrueにすることでひとつひとつの交わるboxのなかに数値を表示させることができる。 -
square
squareをTrueにすると、ひとつひとつの枠が正方形になって見やすくなるのでおすすめ。 -
fmt
枠の中の文字列に与えるルール。上記では .2f とし、少数第2点までを表示させている。 -
annot_kws
annotがTrueの時の文字列の操作。 -
yticklabels
y軸においての値。ここでは、correlation(相関)を見るので、x,yともにiris内のキーを入れる。 -
xticklabels
同様にx軸においての値。 -
cmap
matplotlibでも使われるカラーコードをseabornにおいても使うことができる。カラーコード一覧については下記のリンクを参照。今回は'Accent'のカラーコードを使用。

