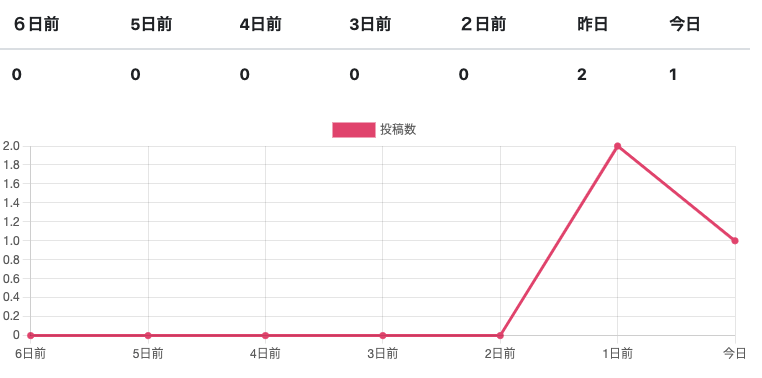
やりたいこと
過去7日間の投稿数を取得し、折れ線グラフで表示する. グラフが表示できなかったり、12日分表示してしまったり・・・ととにかく大変でした。 そもそもJavascriptの知識が浅いため、、難しかったです。注意
今回gemでChartkickを入れてますが、グラフの記述は、 完全にchart.jsの基本フォーマットで記載しています。 Chartkickはchart.jsもサポートしているため、gemがChartkickで、 グラフの記述がchart.jsの記述方法でもグラフが表示されます。7日間の投稿データ取得
前回作成した記事と同様です。グラフ化が大変だったのでここはサクッと行きます![]()
違う点は、、
コントローラーに記述しなくても、モデルで定義した値をviewで使用できるということです。
7日間の投稿データ取得
   scope :created_today, -> { where(created_at: Time.zone.now.all_day) }
  scope :created_yesterday, -> { where(created_at: 1.day.ago.all_day) }
  scope :created_2days, -> { where(created_at: 2.days.ago.all_day) }
  scope :created_3days, -> { where(created_at: 3.days.ago.all_day) }
  scope :created_4days, -> { where(created_at: 4.days.ago.all_day) }
  scope :created_5days, -> { where(created_at: 5.days.ago.all_day) }
  scope :created_6days, -> { where(created_at: 6.days.ago.all_day) }
def show
    @user=User.find(params[:id])
    @books = @user.books.page(params[:page]).reverse_order
    @today_book =  @books.created_today
    @yesterday_book = @books.created_yesterday
    @this_week_book = @books.created_this_week
    @last_week_book = @books.created_last_week
    @book=Book.new
end
<table class="table">
   <thead>
    <tr>
     <th>6日前</th>
     <th>5日前</th>
     <th>4日前</th>
     <th>3日前</th>
     <th>2日前</th>
     <th>昨日</th>
     <th>今日</th>
    </tr>
   </thead>
   <tbody>
    <tr>
     <th><%= @books.created_6days.count %></th>
     <th><%= @books.created_5days.count %></th>
     <th><%= @books.created_4days.count %></th>
     <th><%= @books.created_3days.count %></th>
     <th><%= @books.created_2days.count %></th>
     <th><%= @yesterday_book.count %></th>
     <th><%= @today_book.count %></th>
    </tr>
   </tbody>
  </table>
 もっと綺麗なコンパクトなコードにリファクタリング可能です
グラフ化①・・・chart.js ? chartkick をいれる
chart.jsで検索するとchartkickが出てきます。
もう何を入れるのか分からなくなりました![]()
→chartkickのgemはchart.jsもカバーしてるので、
chartkickを入れました。
Gemインストール
以下の記事の通り行いました。groupdateもインストールしてしまいましたが、今回使わなかったです。
(正しくは、理解できず、うまく使えなかったです・・・)
Turbolinksの無効化
無効化にしないと、グラフが表示されないのではないかと思います。
と、思っていたのですが、別のアプリケーションで無効果せずに作成したところ、
表示されました。グラフが表示されない場合は、無効化を試してみてください。
私は、とにかくTurbolinksの記述を全削除してしまいましたが、個別削除がベストですね。
以下の記事で全削除できます。
Viewの記述
chart.jsの基本フォーマットを元に作成しております。
Turbolinks全削除済みの場合
<canvas id="myChart" width="300" height="100"> </canvas>

    <script>
    var ctx = document.getElementById("myChart").getContext('2d');
    var myChart = new Chart(ctx, {
        type: 'line',
        data: {
            labels: ['6日前', '5日前', '4日前', '3日前', '2日前', '1日前', '今日'],
            datasets: [{
                label: "投稿数",
                data: [<%= @books.created_6days.count %>, <%= @books.created_5days.count %>, <%= @books.created_4days.count %>, <%= @books.created_3days.count %>, <%= @books.created_2days.count %>, <%= @yesterday_book.count %>, <%= @today_book.count%>],
                backgroundColor: 'rgba(255, 80, 120, 1.0)',
                borderColor: 'rgba(255, 80, 120, 1.0)',
                fill: false
            }]
        },
    });
</script>
Turbolinksを個別で無効化
<canvas id="myLineChart"></canvas>
  <script>
      $(document).on('turbolinks:load', function() {
      var ctx = document.getElementById("myLineChart");
      var myLineChart = new Chart(ctx, {
        type: 'line',
        data: {
          labels: ['6日前', '5日前', '4日前', '3日前', '2日前', '1日前', '今日'],
          datasets: [
            {
              label: '投稿した本の数',
              data: [<%= @books.created_6days.count %>, <%= @books.created_5days.count %>, <%= @books.created_4days.count %>, <%= @books.created_3days.count %>, <%= @books.created_2days.count %>, <%= @yesterday_book.count %>, <%= @today_book.count%>],
              borderColor: "rgba(0,0,255,1)",
              backgroundColor: "rgba(0,0,0,0)"
            }
          ],
        },
        options: {
          title: {
            display: true,
            text: '7日間の投稿数の比較'
          },
          scales: {
            yAxes: [{
              ticks: {
                suggestedMax: 10,
                suggestedMin: 0,
                stepSize: 1,
                callback: function(value, index, values){
                  return  value
                }
              }
            }]
          },
        }
      });
    });
  </script>
これで、折れ線グラフの表示ができました。
参考にさせていただいた記事
以下の記事でも、グラフができましたが12日分表示されてしまいました。
どうやって7日間分に抑えれば良いのだろう??
今回、groupdate使えこなせてないですが、使えたら便利
