目的
IBM Citrix Netscaler VPXを活用して、Webサーバへのロードバランスを試してみた。
今回は、分散方式を変更した際の動作を確認する。
環境
- ローカル端末:macOS Catalina 10.15.6 1台
- プラットフォーム:IBMCloud
- ロードバランサ:Citrix NetScalerVPX NS11.1: Build 64.14.nc 1サービス
- DNSサービス:IBMCloud DNS 1サービス
- 接続先サーバ:CentOS 7.7.1908(Virtual Server for Classic) 2台
概要構成図

分散方式アルゴリズム
多すぎるので、3つだけ検証した。
- Round Robin
- Round Robin + Weight
- Leastconnection
分散方式の考え方はおおよそこんな感じ

まずは分散方式アルゴリズムの変更場所から
Traffic Management -> Load Balancing -> Virtual Servers -> 変更対象Name選択 -> Editを選択する。

右メニューにある、Methodを選択する。
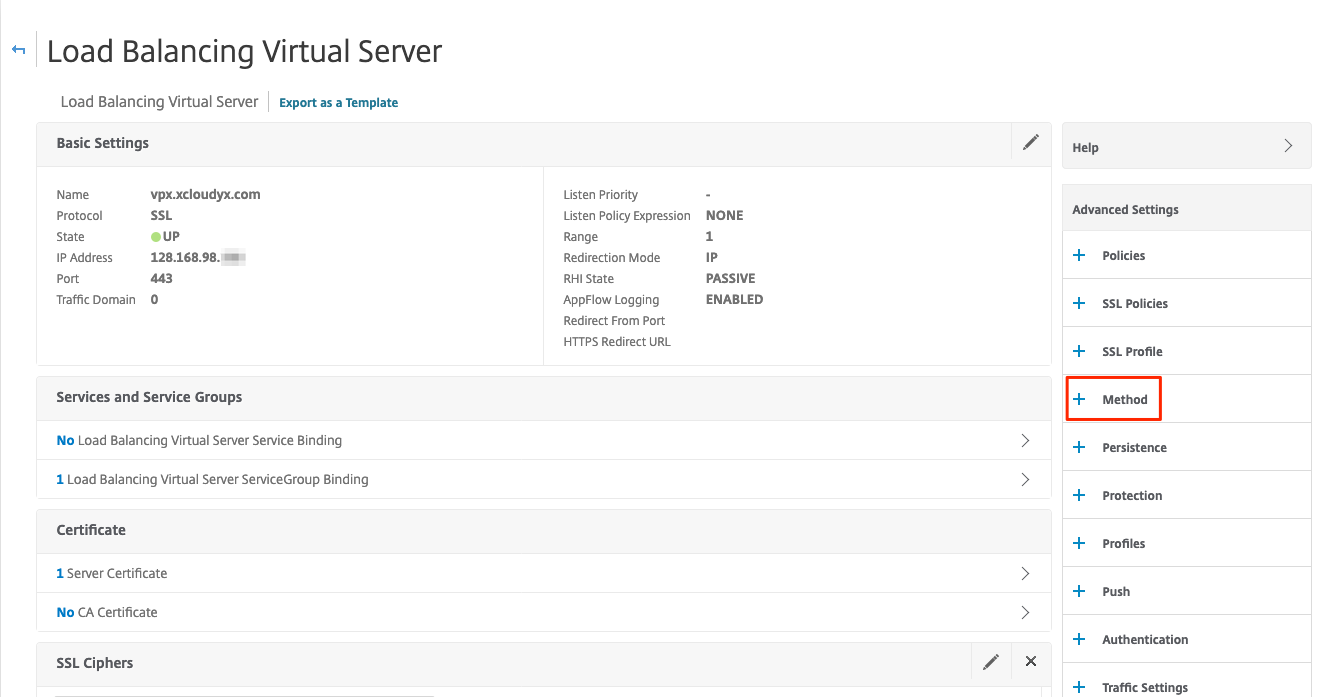
↓から分散アルゴリズムを選択できる。

Round Robin動作確認
綺麗に交互分散されているのがわかる。
% while true; do curl -w "gettime:%{time_total} " https://vpx.xcloudyx.com; done
gettime:0.470531 TOK05-SV01
gettime:0.276228 TOK04-SV11
gettime:0.171754 TOK05-SV01
gettime:0.321132 TOK04-SV11
gettime:0.141350 TOK05-SV01
gettime:0.310030 TOK04-SV11
gettime:0.180100 TOK05-SV01
gettime:0.313649 TOK04-SV11
gettime:0.182039 TOK05-SV01
Round Robin + Weight動作確認
Weightの変更場所から
Traffic Management -> Load Balancing -> Service Groups -> 変更対象Name選択 -> Editを選択する。

Service Group Membersの右にある**>**を選択する。

変更対象の□にチェック後、Editを選択する。

ここで、Weightを変更する
Weightが高いほうが、分散対象に選ばれやすくなる。
- SV01 Weight: 1
- SV11 Weight: 10

設定通り、server11のweightを極端に高くしたので、10/11でserver11へアクセスしている。
% while true; do curl -w "gettime:%{time_total} " https://vpx.xcloudyx.com; done
gettime:0.065687 TOK05-SV01
gettime:0.073623 TOK04-SV11
gettime:0.059267 TOK04-SV11
gettime:0.056076 TOK04-SV11
gettime:0.053174 TOK04-SV11
gettime:0.047798 TOK04-SV11
gettime:0.047068 TOK04-SV11
gettime:0.050882 TOK04-SV11
gettime:0.051138 TOK04-SV11
gettime:0.048069 TOK04-SV11
gettime:0.052989 TOK04-SV11
Least Connection動作確認
綺麗に交互分散されているのがわかる。
※セッションを再利用するので、参考程度
% while true; do curl -w "gettime:%{time_total} " https://vpx.xcloudyx.com; done
TOK05-SV01
gettime:0.076259 TOK04-SV11
gettime:0.051495 TOK05-SV01
gettime:0.059972 TOK04-SV11
gettime:0.051786 TOK05-SV01
gettime:0.048222 TOK04-SV11
gettime:0.052051 TOK05-SV01
gettime:0.052983 TOK04-SV11
gettime:0.048353 TOK05-SV01
gettime:0.054499 TOK04-SV11