UMAPがバージョンアップしてv0.4が公開された。
2020/02/10現在では、pip install --pre umap-learnでバージョンを上げることができる。
疎行列をそのまま入力できたりいろんな機能が追加されているらしいけど、ここではプロット機能、非ユークリッド空間への埋め込み、逆変換を試してみる。
データだけ変えてほぼドキュメントに書いてあるコード例そのままやってるだけなので、それぞれについて詳しくはUMAPドキュメントへ。
データ
PARCのレポジトリに置いてあったscRNA-seqのデータセットとアノテーション(Zheng et al., 2017, 10X PBMC)を使って実験する。68,579細胞、事前にPCAで50次元に圧縮済み。気軽にやるにはちょっと大きすぎるデータなので適当に1万細胞くらいに落として使う。
import numpy as np
import pandas as pd
import umap
データ読み込み。1万細胞、50主成分。
dat = np.loadtxt('./data/pca50_pbmc10k.txt', delimiter=',')
dat.shape
(10000, 50)
アノテーションは以下のような感じ。
labels = []
for line in open('./data/zheng17_annotations_10k.txt'):
    labels.append(line.rstrip())

import collections
import pprint
pprint.PrettyPrinter(indent=4).pprint(collections.Counter(labels))
Counter({   'CD4+/CD45RA+/CD25- Naive T': 1853,
            'CD8+ Cytotoxic T': 1694,
            'CD8+/CD45RA+ Naive Cytotoxic': 1599,
            'CD4+/CD45RO+ Memory': 1425,
            'CD56+ NK': 1211,
            'CD4+/CD25 T Reg': 828,
            'CD14+ Monocyte': 595,
            'CD19+ B': 583,
            'Dendritic': 127,
            'CD4+ T Helper2': 55,
            'CD34+': 30})
とりあえずは普通にUMAPしておく。
model = umap.UMAP(verbose=True)
model.fit(dat)
プロット機能
umap.plotで新たに、umap単体でプロットができるようになった。
matplotlibで描くのとほとんど変わらないけど、手軽ではある。
umap.plotを使う場合はumapと別にdatashader, bokeh, holoviewsが必要なので注意。それぞれインストールしておく。
import umap.plot
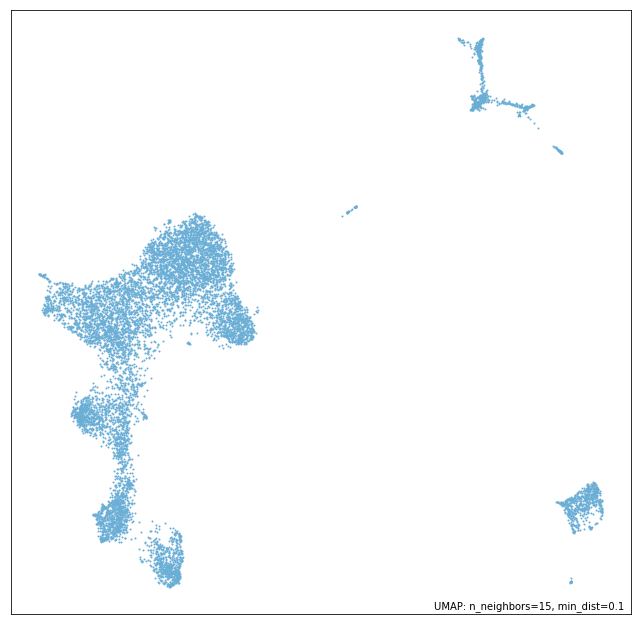
学習させたモデルのインスタンスを与えると、scatter plotを描いてくれる。
umap.plot.points(model)
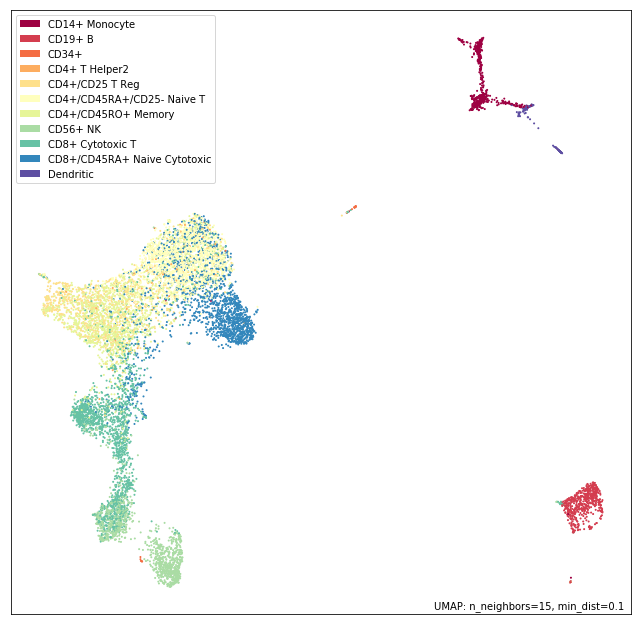
また、labelsのパラメータにそれぞれの点のラベルデータを与えると色分けして描いてくれる。
umap.plot.points(model, labels=labels)
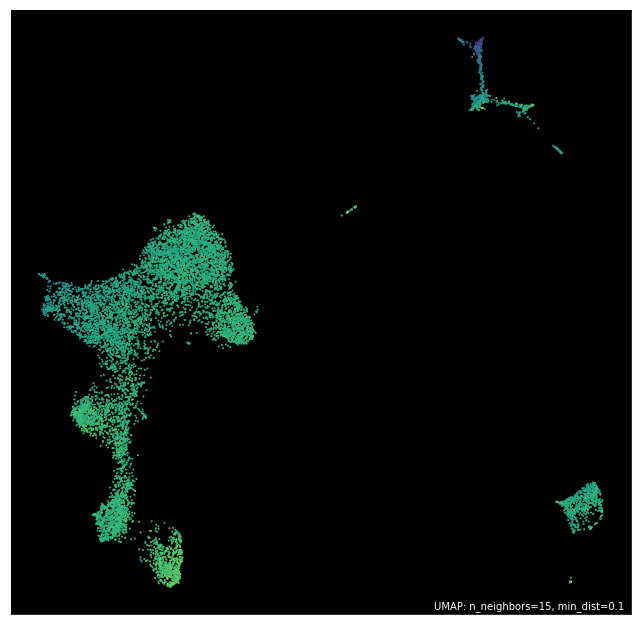
与えるデータは連続値でもOK。ここでは適当なデータがないので、元データの平均値を与える。
背景やカラーマップなどの組み合わせを用意してくれてるので、themeパラメータで好きなものを選んで使える。
選べるthemeは次の9種類。
umap.plot._themes.keys()
dict_keys(['fire', 'viridis', 'inferno', 'blue', 'red', 'green', 'darkblue', 'darkred', 'darkgreen'])
umap.plot.points(model,
                 values=dat.mean(axis=1),
                 theme='viridis')
また、Bokehを使ってインタラクティブなプロットを描くことも可能。
umap.plot.output_notebook()
マウスオーバーしたときに表示する情報は事前にpandas.dataframeのかたちで用意しておく。
df_labels = pd.DataFrame(labels, columns=['celltype'])
p = umap.plot.interactive(model, labels=labels,
                          hover_data=df_labels, point_size=2)
umap.plot.show(p)

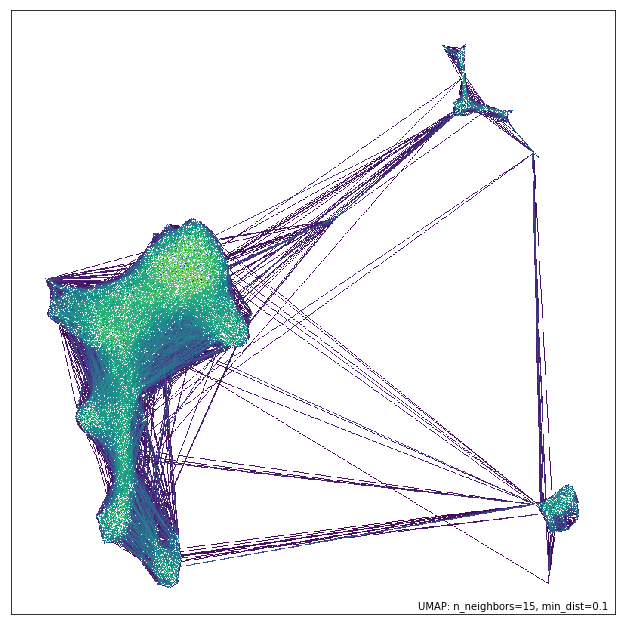
さらに、UMAP埋め込みのときに使われたneighborhood graphを可視化してくれる機能もある。エッジの重みもグラデーションで表示してくれる。どういったconnectivityが学習されたのかを検証するときに使えるかもしれない。
umap.plot.connectivity(model, show_points=True,
                      edge_cmap='viridis')
他にも、様々な指標で埋め込みを診断するためのdiagnostic plot機能があるらしい。
非ユークリッド空間への埋め込み
デフォルトではUMAPはユークリッド空間に埋め込む(低次元空間のユークリッド距離をターゲットに最適化する)が、球面など他のタイプの空間に埋め込むことも可能らしい。
これは、output_metricパラメータで低次元側の距離計算手法を指定することで可能。
まず、球面に埋め込んでみる。球面埋め込みの場合は、Haversine式を指定する。
sphere_mapper = umap.UMAP(output_metric='haversine')
sphere_mapper.fit(dat)
結果の座標は球面座標系で出てくるので、そのまま描いてもよくわからない。なので教科書通りに直交座標系に変換してからプロットしてみる。
x = np.sin(sphere_mapper.embedding_[:, 0]) * np.cos(sphere_mapper.embedding_[:, 1])
y = np.sin(sphere_mapper.embedding_[:, 0]) * np.sin(sphere_mapper.embedding_[:, 1])
z = np.cos(sphere_mapper.embedding_[:, 0])
このプロットは勝手にやってくれないみたいなので、自分でmatplotlibで描画。
import matplotlib.pyplot as plt
from mpl_toolkits.mplot3d import Axes3D
import seaborn as sns
sns.set(style='white')

categories = sorted(list(set(labels)))
label_ids = [categories.index(l) for l in labels]

fig = plt.figure(figsize=(12, 12))
ax = fig.add_subplot(111, projection='3d')
ax.scatter(x, y, z, c=label_ids, cmap='Spectral')
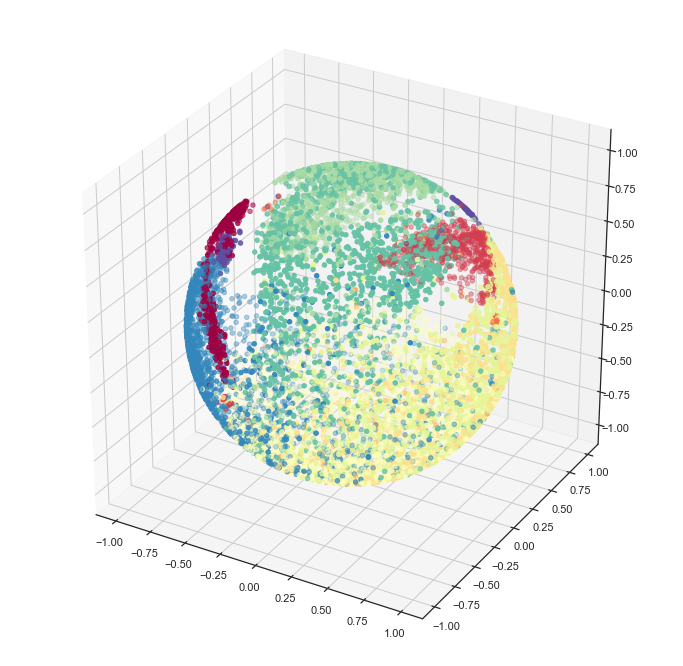
セルタイプごとにわりときれいに、球面上にまとまってくれた。
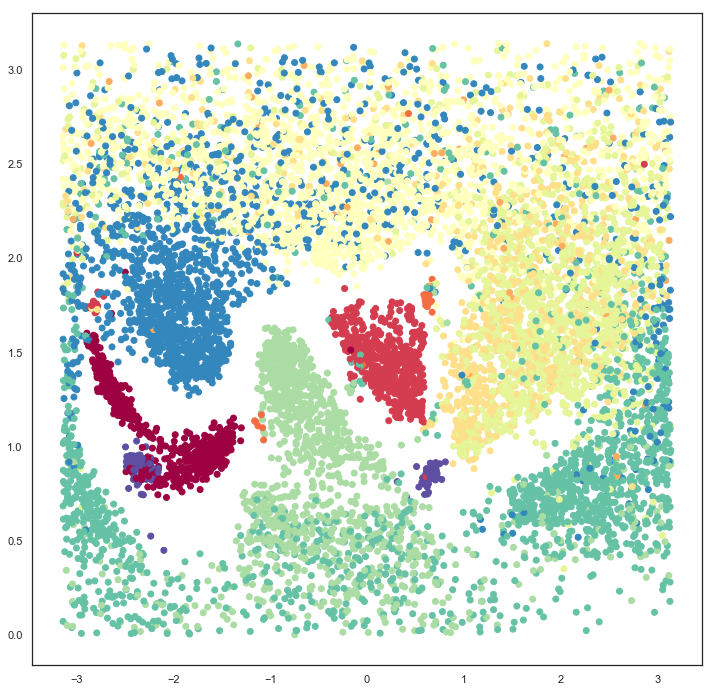
3次元でちょっとわかりづらいので、このまま2次元に展開してみる。
x = np.arctan2(x, y)
y = np.arccos(z)
fig = plt.figure(figsize=(12, 12))
plt.scatter(x, y, c=label_ids, cmap='Spectral')
左右は本来つながってる。
どういったときに使えばいいのかよくわからないけど、データが本質的に周期的な性質を持つときなどに有効?
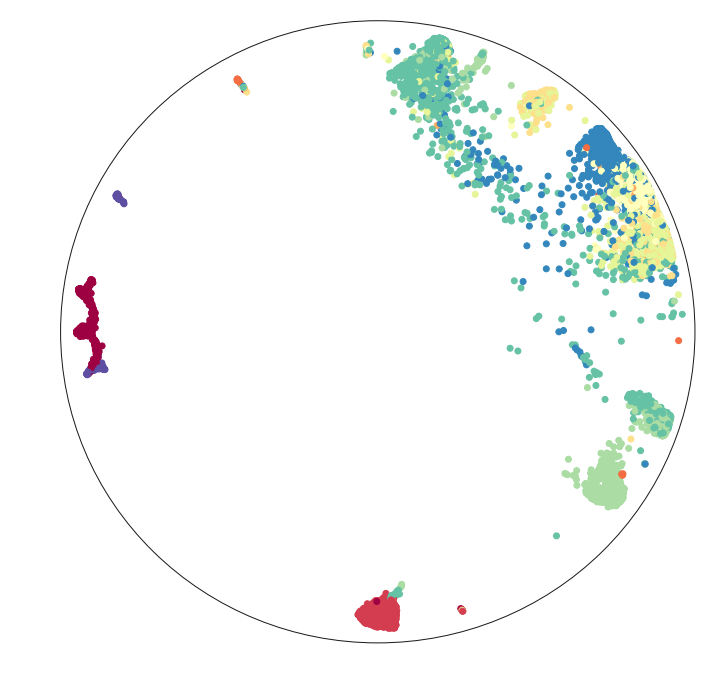
また、双曲空間への埋め込みも紹介されている。これについてはほんとによくわからないのでドキュメントの流れそのままやってみる。ポアンカレ円板モデルそのものは最適化が難しいらしいので、Hyperboloid modelをターゲットに学習しているらしい。
hyperbolic_mapper = umap.UMAP(output_metric='hyperboloid')
hyperbolic_mapper.fit(dat)

x = hyperbolic_mapper.embedding_[:, 0]
y = hyperbolic_mapper.embedding_[:, 1]
z = np.sqrt(1 + np.sum(hyperbolic_mapper.embedding_**2, axis=1))

disk_x = x / (1 + z)
disk_y = y / (1 + z)

fig = plt.figure(figsize=(12,12))
ax = fig.add_subplot(111)
ax.scatter(disk_x, disk_y, c=label_ids, cmap='Spectral')
boundary = plt.Circle((0,0), 1, fc='none', ec='k')
ax.add_artist(boundary)
ax.axis('off');
逆変換
埋め込みが学習された低次元側の座標から、対応する高次元サンプルを生成する手法。
VAEみたいな生成モデルと同じように使うのは難しいかもしれないけど、埋め込まれた低次元がどんな空間なのかざっと確認するのには便利かも。
高次元サンプル生成についてはシングルセルのデータはあんまりおもしろくないので、ここではKuzushiji-MNISTのデータ(を適当に1万個ランダムに選んだもの)でやってみる。
dat = np.load('./data/kmnist-train-imgs_10k.npy')
dat.shape
(10000, 784)
labels = np.load('./data/kmnist-train-labels_10k.npy')
labels
array([4, 5, 0, ..., 6, 9, 0], dtype=uint8)
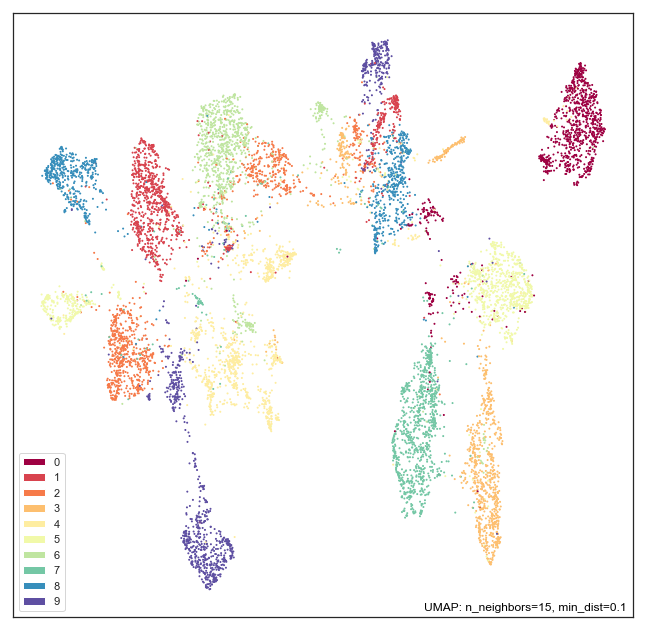
まずは普通にUMAPを計算してみる。
model = umap.UMAP(n_epochs=500, verbose=True).fit(dat)

umap.plot.points(model, labels=labels)
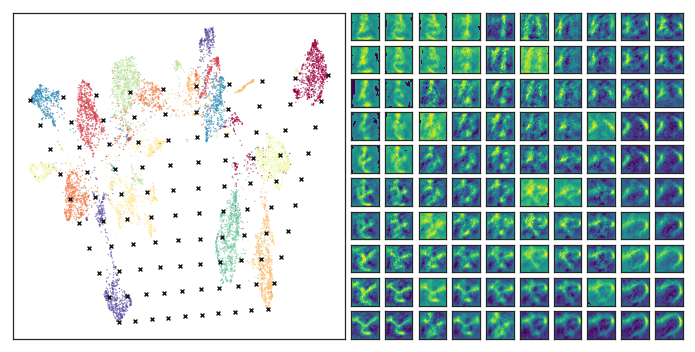
この空間から、補間しておもしろそうな領域について逆変換してみたいので、
クラスタ8の左上、クラスタ9の左下、クラスタ0の右上、クラスタ3の右下あたりの点を選んで、テスト用の点を100個作ってみる。
x = model.embedding_

top_left = x[labels == 8, :][x[labels == 8, 0].argmin()]
btm_left = x[labels == 9, :][x[labels == 9, 1].argmin()]
top_right = x[labels == 0, :][x[labels == 0, 0].argmax()]
btm_right = x[labels == 3, :][x[labels == 3, 1].argmin()]

test_pts = np.array([
    (top_left*(1-x) + top_right*x)*(1-y) +
    (btm_left*(1-x) + btm_right*x)*y
    for y in np.linspace(0, 1, 10)
    for x in np.linspace(0, 1, 10)
])

print(top_left)
print(btm_left)
print(top_right)
print(btm_right)
[-3.0056033  9.982167 ]
[2.0912035 2.2021403]
[14.147088  10.8581085]
[10.669375   2.6710818]
逆変換を実行する。inverse_transform関数に調べたい点の座標を与える。
inv_transformed_points = model.inverse_transform(test_pts)

from matplotlib.gridspec import GridSpec

fig = plt.figure(figsize=(12,6))
gs = GridSpec(10, 20, fig)
scatter_ax = fig.add_subplot(gs[:, :10])
kuzushiji_axes = np.zeros((10, 10), dtype=object)
for i in range(10):
    for j in range(10):
        kuzushiji_axes[i, j] = fig.add_subplot(gs[i, 10 + j])

scatter_ax.scatter(model.embedding_[:, 0], model.embedding_[:, 1],
                   c=labels.astype(np.int32), cmap='Spectral', s=0.1)
scatter_ax.set(xticks=[], yticks=[])

scatter_ax.scatter(test_pts[:, 0], test_pts[:, 1], marker='x', c='k', s=15)

for i in range(10):
    for j in range(10):
        kuzushiji_axes[i, j].imshow(inv_transformed_points[i*10 + j].reshape(28, 28), cmap='viridis')
        kuzushiji_axes[i, j].set(xticks=[], yticks=[])
ちょっと粗いが、軸に沿ってどのように遷移するのか、また、クラスタどうしがなぜ近い距離に配置されているのかがなんとなく類推できる。
