概要
Prometheus入門 にあるチュートリアルを
Ansibleで簡単に構築できるようにした、
というものです。
先日2016年6月14日、
LINE株式会社でのPrometheus Casual Talks #1に参加し
ナレッジのおさらいなどしたく、
構築法をまとめました。
Prometheusとは
最近話題のPull型のQuery Filtering可能で Grafana等と連携できる モニタリング/Alertツールです。
構成
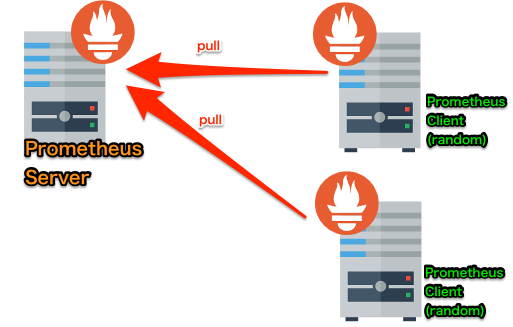
- Prometheus Server × 1
- Prometheus Client × 2
環境
- CentOS 6.5
- Prometheus Server 0.20.0
- Supervisor 3.3.0
- Go 1.6.2
- Ansibl 2.1.0.0
- Vagrant 1.8.1
- MacOSX 10.11.5
前提条件
以下ツールをインストールしておいてください。
- VirtualBox
- Vagrant
- Ansible
使い方
1. git repository を clone
$ git clone https://github.com/kenzo0107/Vagrant-Prometheus
2. Vagrant VM 起動
$ cd Vagrant-Prometheus
$ vagrant up
3 node running !
- 1 node: Prometheus Server
- 192.168.11.30
- other 2 nodes: Prometheus Client Server
- 192.168.33.31
- 192.168.33.32
3. ssh.config 追加
$ vagrant ssh-config > ssh.config
4. ping 疎通試験
$ ansible default -m ping

server | SUCCESS => {
    "changed": false,
    "ping": "pong"
}
client1 | SUCCESS => {
    "changed": false,
    "ping": "pong"
}
client2 | SUCCESS => {
    "changed": false,
    "ping": "pong"
}
ok, success.
5. 2node に PrometheusClient 設定
$ ansible-playbook set_clients_prometheus.yml
6. PrometheusClient の起動確認
以下PrometheusClientを起動しているサーバにアクセスし
起動されているか確認します。
以下のように表示されれば成功です。

7. PrometheusServer 設定
$ ansible-playbook set_server_prometheus.yml
8. PrometheusServer 確認
http://192.168.33.30:9090 にアクセス
以下のように表示されれば成功です。

是非多少なりとも一助となれば何よりです!
いじくり倒してみてください!
以上