DMMグループ Advent Calendar 2020の22日目の記事です。
はじめに
こんにちは、EXNOAでフロントエンドエンジニアとして働いている@_kentaro_mです。
本記事ではWebサイトパフォーマンス (以下、パフォーマンス) を継続的に計測する基盤のプロトタイプを作った話をしたいと思います。
モチベーション
まずはパフォーマンスを継続的に計測したいモチベーションについて、触れておこうと思います。
昨今ではGoogleがCore Web Vitalsと呼ばれるWebサイトにおけるユーザー体験の質を定量的に示す指標を公開し、ユーザー体験がこれまで以上に重要視される流れになることが予想されます。
そして、パフォーマンスはユーザー体験に大きな影響を与える要素となっており、継続的な計測や改善を行っていく必要があると思います。
現在EXNOAではゲームプラットフォームのアーキテクチャ刷新に取り組んでおり、今後パフォーマンスが大きく変化する可能性があります。中長期に渡ってパフォーマンス改善に取り組むには、時系列で指標の数値が良くなったあるいは悪くなったという状況変化を見る必要があります。そのためには機械的かつ継続的な計測の実現が鍵になると考えてます。
今回はアドベントカレンダーという機会を利用して、パフォーマンスを継続的に計測するシステムのプロトタイプを作ることにしました。
システム要件
パフォーマンス計測基盤のプロトタイプを作るにあたって、満たしたい要件は以下のように定めました。
- 特定の複数ページ (URL) に対して、Lighthouseを定期的に実行できること
- Lighthouseの実行結果をストレージに保存したり、外部サービスに送信できたりすること
- 外部サービスはDatadogやSlackなどを想定
- 何らかのツールを使って、Lighthouseの実行結果が可視化できること
- 各指標ごとにグラフを作れて、時系列で推移が確認できるものをイメージ
パフォーマンス計測ツールはLighthouseを利用することにしました。Core Web Vitalsの指標が測定できることと社内での利用実績があることが理由です。
システム構成
システム要件を満たすように、技術選定とシステム構成を検討しました。
また、Lighthouse (灯台) の実行を管理する基盤なので、Lighthouse Keeper (灯台守) という名前をシステムにつけました。
構成図
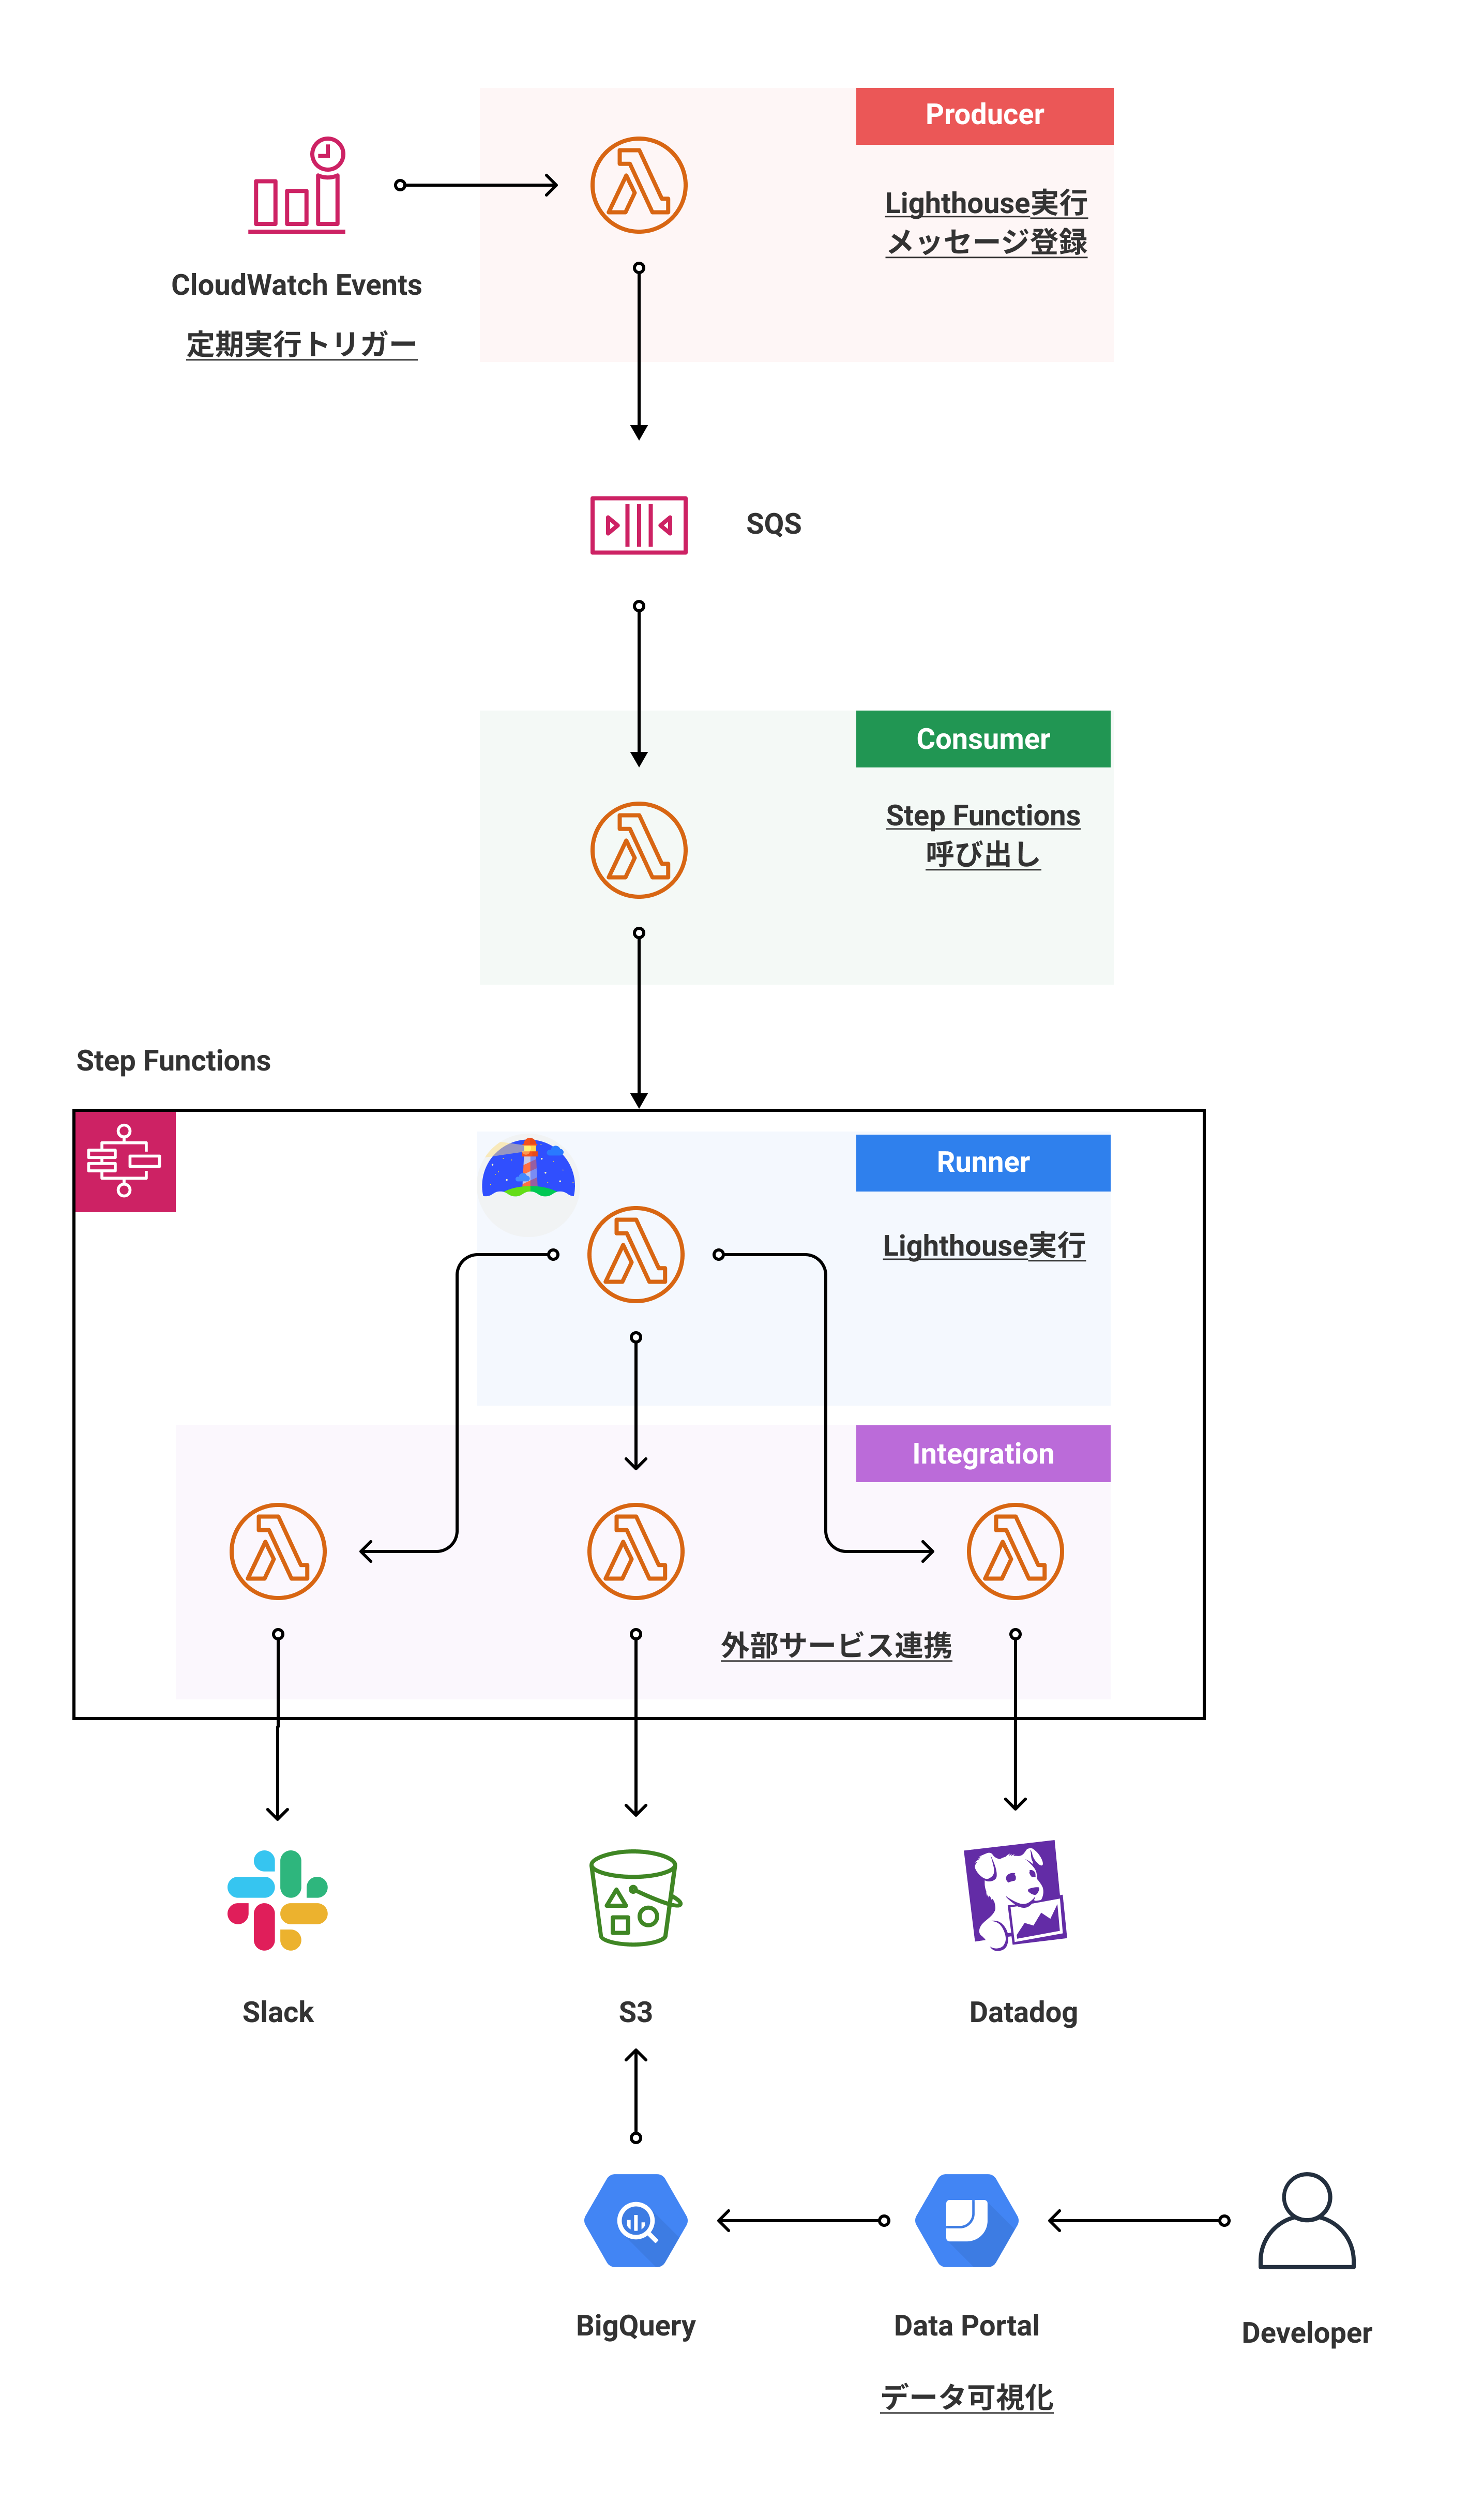
最終目標の構成図です。現状ではSlackとDatadogにデータを送信するLambdaは未完成。
処理フロー
- CloudWatch Eventsが事前に定義したスケジュールでProducer (Lambda function) を呼び出し
- ProducerはLighthouseを実行する命令 (メッセージ) を各サイト (URL) ごとにSQSに登録
- SQSへのメッセージ追加をトリガーに、Consumer (Lambda function) が起動され、Step Functionsを呼び出す
- Runner (Lambda function) はLighthouseを実行し、結果を戻り値として返す
- Integration (Lambda function) はRunnerからLighthouseの結果を受けとり、ストレージへの保存や外部サービスへの送信等の任意の処理を行う
使用技術
自分が手慣れているAWSのサービスを中心に技術選定を行いました。利用サービスと用途は以下の通りです。
- CloudWatch Events
- Lighthouseを定期的に実行するためのイベントトリガー
- cron式かrate式で実行スケジュールを定義
- Lighthouseを定期的に実行するためのイベントトリガー
- AWS Lambda
- 複数の用途で利用
- Lighthouseの実行
- 外部サービスへのLighthouse実行結果の送信
- ストレージへのLighthouse実行結果の保存
- 複数の用途で利用
- Amazon SQS
- Lighthouseの実行イベントを管理
- 各サイト (URL) ごとに実行イベントを登録
- Lighthouseの実行イベントを管理
- Amazon S3
- Lighthouse実行結果の保存場所
- AWS Step Functions
- 複数のLambdaを連携させるワークフローの管理
- Lighthouseの実行と外部サービスの連携をまとめて管理
- 複数のLambdaを連携させるワークフローの管理
- AWS SAM
- 各種AWSサービスのInfrastructure as Code管理
- Google BigQuery
- Lighthouse実行結果に対してのクエリ実行
- Google Data Portal
- Lighthouse実行結果の可視化
動作の仕組み
パフォーマンス計測基盤の各処理ごとに動作の仕組みを見ていきたいと思います。
パフォーマンス計測の定期実行管理
Lighthouseを実行する対象のサイトが複数あり、それぞれのサイトごとに処理時間が異なるため、パフォーマンス計測を非同期処理として、実装しました。
Producer (Lambda function) がYAML形式のサイトリストをベースに、SQSにLighthouseの実行対象URLを含んだメッセージを送信します。この処理はCloudWatch Eventsを実行トリガーとしており、任意の時間ごとに動作します。
そのあとに、SQSからのメッセージを受信するConsumer (Lambda function) が、Lighthouse実行と外部サービス連携を担うStep Functionsを呼び出します。これにより、Lighthouseはサイトリストと同じ数だけ並列実行されます。
# Lighthouse実行対象サイトリスト

sites:
  - title: Foo
    url: https://foo.example.com/
  - title: Bar
    url: https://bar.example.com/
  - title: Baz
    url: https://baz.example.com/
  - title: Qux
    url: https://qux.example.com/
  - title: Quux
    url: https://quux.example.com/
// SQSにLighthouseの実行対象URLを含んだメッセージを送信するLambda

import yaml from 'js-yaml'
import fs from 'fs'
import { Handler } from 'aws-lambda'
import { SQS } from 'aws-sdk'

type Site = {
  title: string
  url: string
}

type Config = {
  sites: Site[]
}

export const handler: Handler = async (_, __, callback) => {
  try {
    const sqsQueueUrl = process.env.SQS_QUEUE_URL

    if (!sqsQueueUrl) {
      throw new Error('sqs queue URL is not set.')
    }

    // サイトリスト読み込み
    const config = yaml.safeLoad(fs.readFileSync('./config.yml', 'utf8')) as Config

    const sqs = new SQS({apiVersion: '2012-11-05'})

    // SQSにメッセージ送信
    const requests = config.sites.map(site => sqs.sendMessage({
      DelaySeconds: 10,
      MessageAttributes: {
        'title': {
          DataType: 'String',
          StringValue: site.title
        },
        'url': {
          DataType: 'String',
          StringValue: site.url
        },
      },
      MessageBody: `Run a Lighthouse audits to ${site.url}`,
      QueueUrl: sqsQueueUrl
    }).promise())

    await Promise.all(requests)
  } catch (error) {
    console.log(error)
    return callback(error)
  }

  return callback(null)
}
Lighthouseの実行
Runner (Lambda function) 上でChromiumをヘッドレスで起動し、ターゲットのページに対して、Lighthouseを実行しています。使用しているライブラリは以下の通りです。
-
chrome-aws-lambda
- Lambda動作用に最適化されたChromiumバイナリ
-
puppeteer-core
- Chromiumの起動および操作
-
lighthouse
- Lighthouseの実行
Lighthouseの処理が重いため、Lambdaのメモリサイズは1024MB、タイムアウトは600秒に設定しています。
// Lighthouseを実行して結果を返すLambda

import { runLighthouse } from './lib/lighthouse'
import { SQSEvent, Callback, Context } from 'aws-lambda'

require('dotenv').config()

export const handler = async (event: SQSEvent, __: Context, callback: Callback) => {

  console.log(JSON.stringify(event))

  try {
    // SQSからLighthouse実行対象URLを取得
    const targetUrl = event.Records[0].messageAttributes.url.stringValue

    if (!targetUrl) {
      throw new Error('target URL is failed to get.')
    }

    // Lighthouseを実行
    const result = await runLighthouse(targetUrl)

    console.log(JSON.stringify(result))

    const lhr = result.lhr

    // Lighthouseの実行結果を作成 (必要なものだけフィルタリング)
    const data = {
      userAgent: lhr.userAgent,
      environment: lhr.environment,
      lighthouseVersion: lhr.lighthouseVersion,
      fetchTime: lhr.fetchTime,
      requestedUrl: lhr.requestedUrl,
      finalUrl: lhr.finalUrl,
      audits: {
        'first-contentful-paint': lhr.audits['first-contentful-paint'],
        'largest-contentful-paint': lhr.audits['largest-contentful-paint'],
        'cumulative-layout-shift': lhr.audits['cumulative-layout-shift'],
        'server-response-time': lhr.audits['server-response-time'],
        'max-potential-fid': lhr.audits['max-potential-fid'],
        'interactive': lhr.audits['interactive'],
        'total-blocking-time': lhr.audits['total-blocking-time'],
        'speed-index': lhr.audits['speed-index'],
      }
    }

    console.log(JSON.stringify(data))

    return callback(null, { data })
  } catch(error) {
    console.log(error)
    return callback(error);
  }
}
// Lighthouseの実行処理

const lighthouse = require('lighthouse')
const constants = require('../config/constants')
const chromium = require('chrome-aws-lambda')
const puppeteer = require('puppeteer-core')

export async function runLighthouse(url: string) {
  // ヘッドレスChromeを起動
  const browser = await puppeteer.launch({
    args: chromium.args,
    defaultViewport: chromium.defaultViewport,
    executablePath: await chromium.executablePath,
    headless: chromium.headless,
    ignoreHTTPSErrors: true,
  })

  // Lighthouseを実行
  const result = await lighthouse(url, {
    logLevel: 'info',
    port: (new URL(browser.wsEndpoint())).port,
  }, {
    extends: 'lighthouse:default',
    settings: {
      onlyCategories: ['performance'],
      formFactor: 'desktop',
      throttling: constants.throttling.desktopDense4G,
      screenEmulation: constants.screenEmulationMetrics.desktop,
      emulatedUserAgent: constants.userAgents.desktop,
    },
  });

  await browser.close();

  return result
}
外部サービス連携
Integration (Lambda function) がLighthouseの実行結果をもとに、DatadogやSlackなどの外部サービスへのデータ送信やAmazon S3などのストレージへのデータ保存を行います。
これらにStep Functionsを利用しており、Lighthouseの実行や外部サービス連携などの複数の処理において、責務ごとにLambdaを準備し、疎結合に連携することを可能としました。
Lambda同士の連携はAmazon States Languageと呼ばれるJSON形式の言語でワークフローを定義します。Statesと呼ばれるいくつかの状態を記述することで、Lambdaの呼び出し順を決めることが可能です。また、InputPathやResultPathというパラメーターを利用することで、Lambdaの入出力値をコントロールすることができます。
ワークフローはStep Functionsの機能で可視化されるので、構造が把握しやすいようになっています。
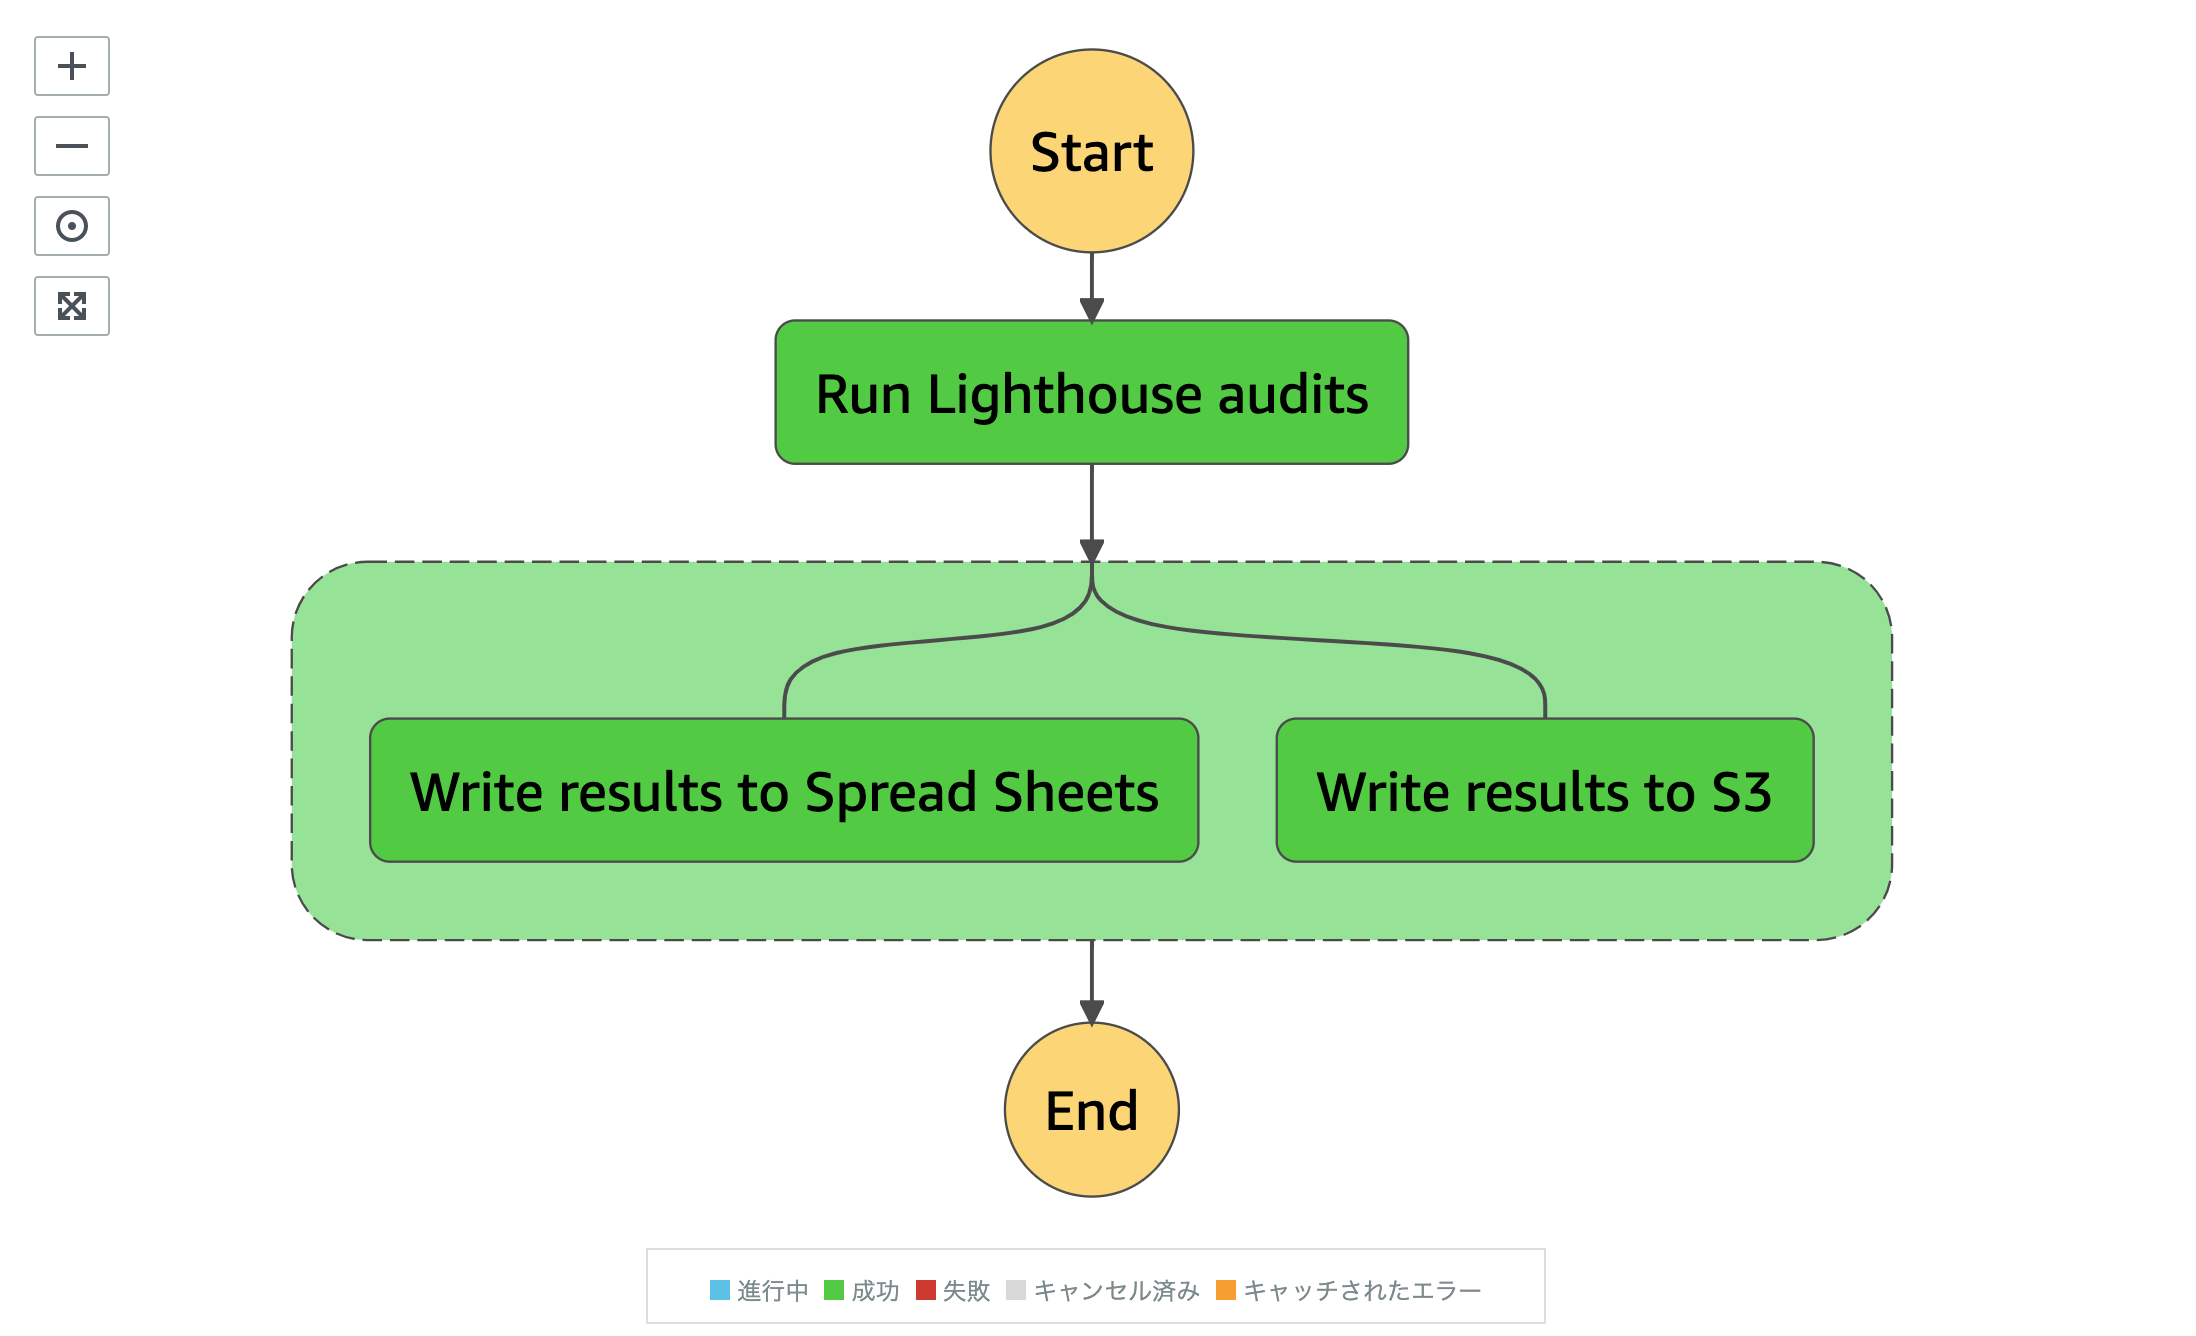
下記に示した例では、Lighthouseを実行したあとに、その結果を利用して、スプレッドシートとS3への書き込みを並列で行うワークフローを表現しています。Runner (Lambda function) でLighthouseの実行結果を戻り値 (ResultPath) に設定することで、次のLambda (Integration) で入力値 (InputPath) として受け取り、結果の書き込みに利用しています。
// Lighthouseの実行とS3とスプレッドシートへの結果書き込みのワークフロー
{
  "StartAt": "Run Lighthouse audits",
  "States": {
    "Run Lighthouse audits": { // Lighthouse実行のタスク
      "Type": "Task",
      "Resource": "${LighthouseKeeperRunnerFunctionArn}",
      "InputPath": "$",
      "Next": "Integrate external services",
      "ResultPath": "$" // Lighthouse実行のLambdaの戻り値を次のLambdaに渡す
    },
    "Integrate external services": {
      "Type": "Parallel", // 並列実行
      "End": true,
      "Branches": [
        {
          "StartAt": "Write results to Spread Sheets", // スプレッドシート書き込みのタスク
          "States": {
            "Write results to Spread Sheets": {
              "Type": "Task",
              "Resource": "${LighthouseKeeperSpreadSheetsFunctionArn}",
              "InputPath": "$", // Lighthouse実行のLambdaの戻り値を引数で受け取り
              "End": true
            }
          }
        },
        {
          "StartAt": "Write results to S3", // S3書き込みのタスク
          "States": {
            "Write results to S3": {
              "Type": "Task",
              "Resource": "${LighthouseKeeperS3FunctionArn}",
              "InputPath": "$", // Lighthouse実行のLambdaの戻り値を引数で受け取り
              "End": true
            }
          }
        }
      ]
    }
  }
}
// Lighthouseの実行結果をS3にアップロードするLambda

import { Handler } from 'aws-lambda'
import { S3 } from 'aws-sdk'

export const handler: Handler = async (event, __, callback) => {
  try {
    console.log(JSON.stringify(event))

    const bucketName = process.env.S3_BUCKET_NAME

    if (!bucketName) {
      throw new Error('s3 bucket name is not set.')
    }

    // event引数に含まれているLighthouse実行結果を整形
    const report = {
      user_agent: event.data.userAgent,
      fetch_time: event.data.fetchTime,
      requested_url: event.data.requestedUrl,
      final_url: event.data.finalUrl,
      performance: {
        first_contentful_paint: {
          score: event.data.audits['first-contentful-paint'].score,
          raw_value: event.data.audits['first-contentful-paint'].numericValue,
        },
        largest_contentful_paint: {
          score: event.data.audits['largest-contentful-paint'].score,
          raw_value: event.data.audits['largest-contentful-paint'].numericValue,
        },
        cumulative_layout_shift: {
          score: event.data.audits['cumulative-layout-shift'].score,
          raw_value: event.data.audits['cumulative-layout-shift'].numericValue,
        },
        server_response_time: {
          score: event.data.audits['server-response-time'].score,
          raw_value: event.data.audits['server-response-time'].numericValue,
        },
        max_potential_fid: {
          score: event.data.audits['max-potential-fid'].score,
          raw_value: event.data.audits['max-potential-fid'].numericValue,
        },
        interactive: {
          score: event.data.audits['interactive'].score,
          raw_value: event.data.audits['interactive'].numericValue,
        },
        total_blocking_time: {
          score: event.data.audits['total-blocking-time'].score,
          raw_value: event.data.audits['total-blocking-time'].numericValue,
        },
        speed_index: {
          score: event.data.audits['speed-index'].score,
          raw_value: event.data.audits['speed-index'].numericValue,
        },
      }
    }

    const s3 = new S3({apiVersion: '2006-03-01'})

    // Lighthouse実行結果をJSON形式でS3にアップロード
    await s3.upload({
      Bucket: bucketName,
      Key: `report_${event.data.fetchTime}.json`,
      Body: JSON.stringify(report, (_, value) => value ? value : null),
      ContentType: 'application/json'
    }).promise()

    return callback(null)
  } catch (error) {
    console.log(error)
    return callback(error)
  }
}
AWS Toolkit for Visual Studio Codeを利用すると、VSCode上でのAmazon State Languageのコード補完やワークフローのプレビューが有効になり、開発効率が上がりました。また、AWS Step Functions Localというローカルでの検証を行うためのツールも発見したので、今後使ってみたいです。
データ可視化
Data PortalとBigQueryを連携させて、Lighthouseの実行結果の可視化を行いました。
Data Portalはデータソースをもとに、ダッシュボードやレポートを作成し、データを見やすい形で可視化するサービスです。今回はデータソースにBigQueryを用いており、Data Portal経由でBigQueryに対して、クエリを実行し、ダッシュボードを作りました。
下記の通り、Lighthouseの指標ごとに、計測したデータがグラフとして表現されています。ダッシュボードの作成はData PortalのUIを操作することで簡単にできました。自分でクエリを組み立てる必要がないのが良いと感じました。

なお、BigQueryへのデータ読み込みは事前に行う必要があります。今回はBigQuery Data Transfer Serviceというサービスを利用して、Amazon S3に保存しているJSON形式のLighthouse実行結果を定期的にBigQueryに読み込んでいます。セットアップはデータ読み込み元のS3バケットとデータ読み込み先のBigQueryのテーブル名、実行スケジュールを設定します。
(BigQueryのテーブルはsahava/multisite-lighthouse-gcpのスキーマを参考に作りました)

さいごに
AWSサービスを活用し、サーバーレスアーキテクチャを採用したことで、実行に時間がかかるLighthouseの計測を非同期かつ並列で実行可能となりました。また、計測結果を利用した外部サービス連携は拡張が容易なワークフローを実現しました。
取り組むべき課題としては、タイムアウトやリトライ、例外処理、監視等の考慮ができていないので、引き続き調査しながら改善していこうと思います。
Webサイトパフォーマンス計測ではLighthouseの計測結果を可視化するところまで確認できました。今後は定期的に実行して、現状のパフォーマンス状況の把握ができれば良いと考えています。
余談になりますが、ちょうどGoogleからWebPageTestやPageSpeed Insights、Lighthouseなどの各種ツールで横断的にパフォーマンスを収集するAuto Web Perfというツールが発表されました。外部サービスへのデータ書き込みも独自のコネクタを書けばできるようなので、自分のやりたいことが実現できる気がしています。こちらのプロジェクトも追いかけていきたいと思ってます。
Automating audits with AutoWebPerf
ソースコード
今回使用したコードは以下のリポジトリにおいています。興味があれば、ご覧ください。