はじめに
Pythonで結果を可視化する際におそらく最も頻繁に使われるmatplotlib. 複数のグラフを並べて出力するとき, 普段は軸ラベルの位置など気に留めないかもしれませんが, 論文やスライドに載せるときには気を遣いたくなるものです.
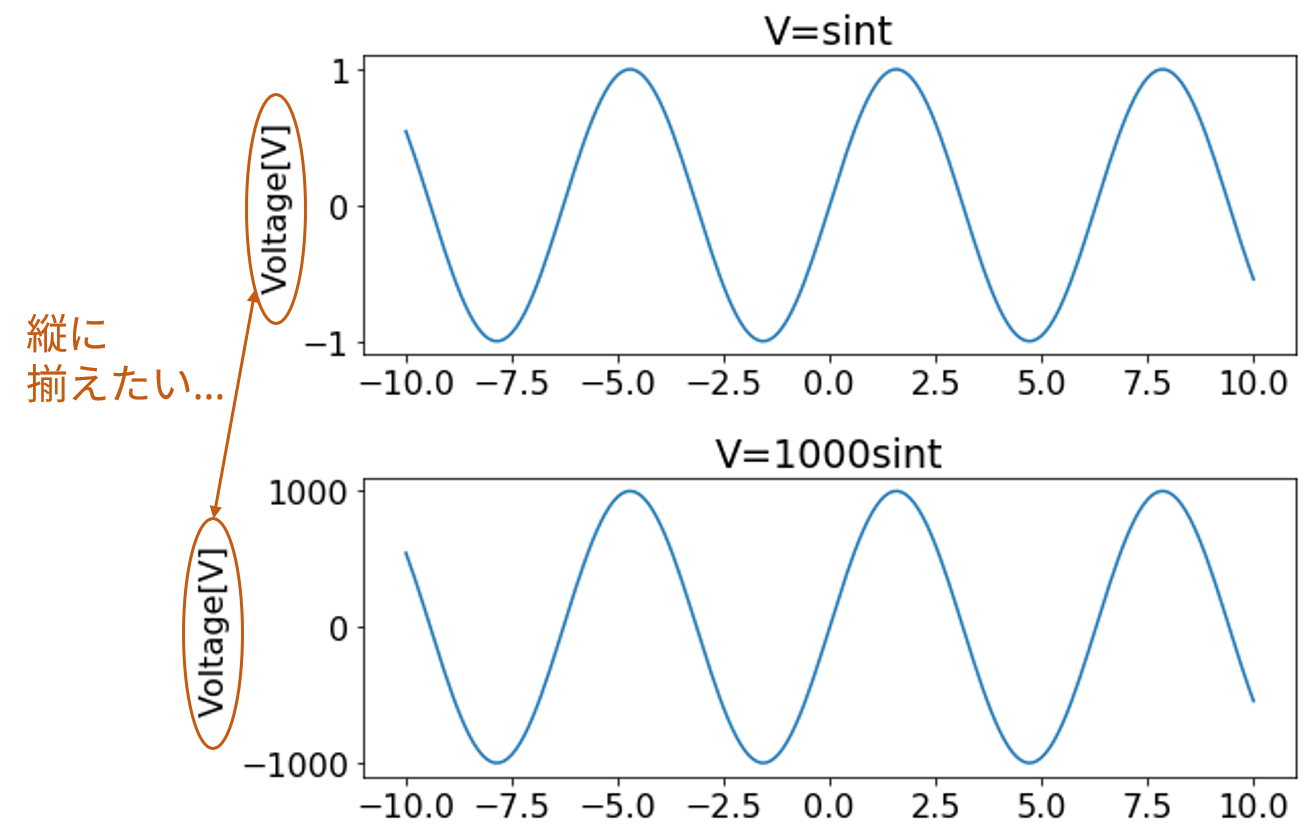
というのも, 自分も卒業論文を書く中で軸ラベルの揃え方を検索していたのですが, 日本語の記事が見つからず, 結局英語の公式ドキュメント12を参照しました. ここでは調べた方法を3通りに分けて説明します.
- 一番手っ取り早い方法
- Axisを使い, 一括で指定する方法
- Axisを使い, 図ごとにマニュアルで指定する方法
準備
matplotlibのバージョンが3.0以上であることを確認してください. 本バージョンから軸ラベルの揃え方が簡単になっていますので, 以前のバージョンをお使いの方はアップデートをおすすめします (Anacondaを利用している方はこちらなどを参考にアップデートして下さい). 自分の環境はPython 3.7.1, matplotlib 3.0.2であり, jupyter notebook上で実行しています.
import numpy as np
import matplotlib.pyplot as plt
%matplotlib inline                #jupyter notebookに図を埋め込む
plt.rcParams["font.size"] = 16    #フォントサイズを大きくする
1. 一番手っ取り早い方法
Axisなんぞ使わないという方向け. plt.figure()する際に
fig = plt.figure(figsize=(6, 4))
のように明示的にfigを作り, 複数のプロットが完了したら
fig.align_labels()
とするだけです. x軸ラベルだけ, あるいはy軸ラベルだけを揃えたい場合,
fig.align_xlabels()    #x軸ラベルを揃える
fig.align_ylabels()    #y軸ラベルを揃える
とすることもできます. 以下, コード例.
# データの用意
x = np.linspace(-10, 10, 201)
y1 = np.sin(x)
y2 = 1000 * np.sin(x)

# ここからプロット
fig = plt.figure(figsize=(8, 6))    #figを明示的に作成

plt.subplot(211)
plt.plot(x, y1)
plt.title("V=sint")
plt.ylabel("Voltage[V]")

plt.subplot(212)
plt.plot(x, y2)
plt.title("V=1000sint")
plt.ylabel("Voltage[V]")

fig.tight_layout()    #文字が重ならないよう調整
fig.align_labels()    #軸ラベルを揃える
plt.show()
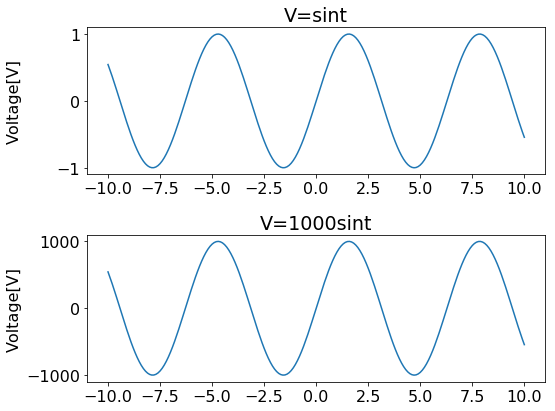
y軸ラベルが揃っていることが分かるかと思います. 凝ったことをする必要がなければこれで十分なのですが, 例えば図1, 2はラベルを揃えて, 図3だけ別の位置に配置…といったことをする場合には, 次に説明するAxisを活用しましょう.
2. Axisを使い, 一括で指定する方法
こちらはaxisベースでプロットをする場合のコードとなります. まずは同様に, 明示的にfigを作ります. 変更する部分は最後の部分で, ラベルを揃えたい図のaxisをリストの形でfig.align_labels()の引数に渡します. コード例を以下に示しました.
# データの用意
y3 = 1000000 * np.sin(x)

# ここからプロット
fig = plt.figure(figsize=(8, 9))

ax1 = fig.add_subplot(311)
ax1.plot(x, y1)
ax1.set_title("V=sint")
ax1.set_ylabel("Voltage[V]")

ax2 = fig.add_subplot(312)
ax2.plot(x, y2)
ax2.set_title("V=1000sint")
ax2.set_ylabel("Voltage[V]")

ax3 = fig.add_subplot(313)
ax3.plot(x, y3)
ax3.set_title("V=1000000sint")
ax3.set_ylabel("Voltage[V]")

fig.tight_layout()
fig.align_labels([ax1, ax2])    #軸ラベルを揃えたい図のaxisを渡す
plt.show()
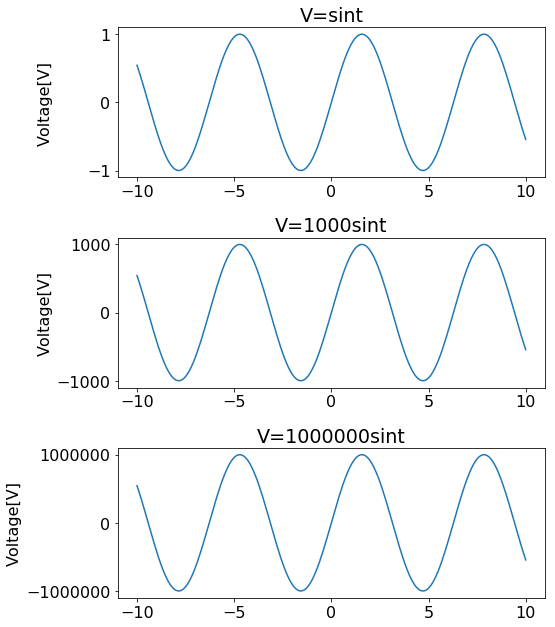
上の2つの図のy軸ラベルだけを揃えることが出来ました.
3. Axisを使い, 図ごとにマニュアルで指定する方法
最後は1つ1つの図ごとに, マニュアルで軸ラベルの表示位置を決める方法です. 各axisに対して
ax1.yaxis.set_label_coords(x, y)
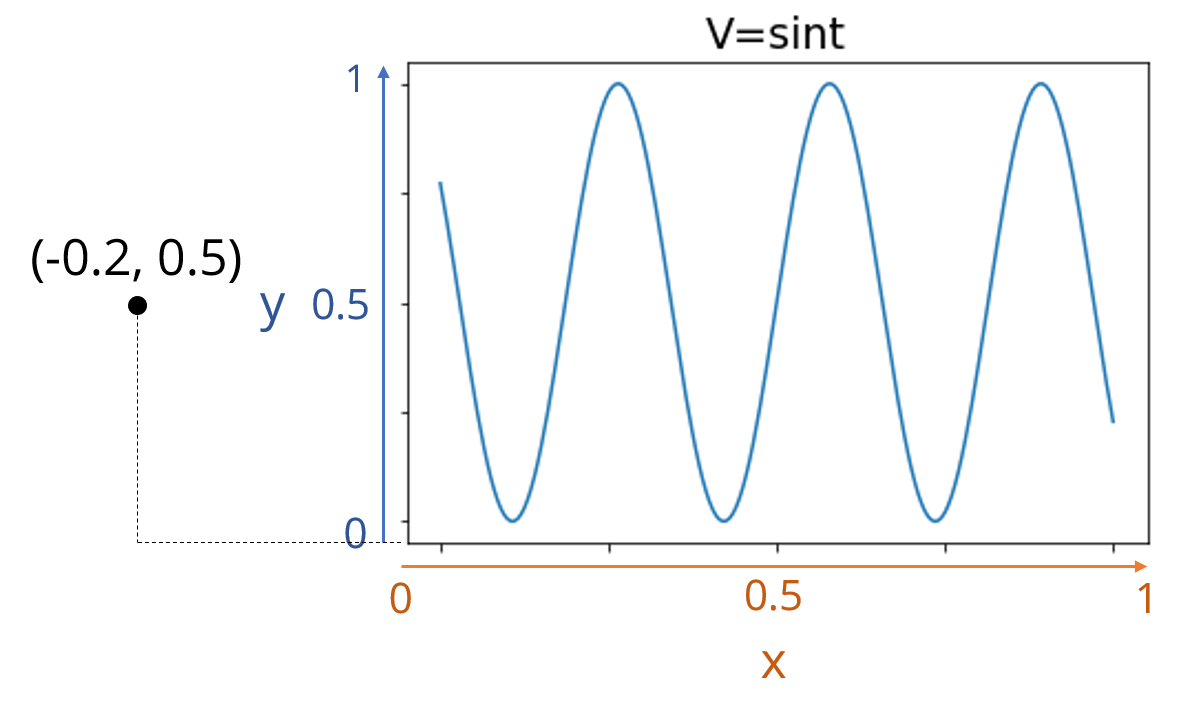
といったように個別でy軸ラベルの位置を決めることが出来ます. 座標系は下図のように定義されているため, xは基本的に負の値で指定します.
x軸ラベルの位置を決定する場合にはax1.xaxis.set_label_coords(x, y)のように変更してください. その際はxが正の値, yが負の値になるよう指定します. 以下, コード例.
# 準備
axs = []
labelx = -0.2

# ここからプロット
fig = plt.figure(figsize=(8, 9))

ax1 = fig.add_subplot(311)
axs.append(ax1)
ax1.plot(x, y1)
ax1.set_title("V=sint")
ax1.set_ylabel("Voltage[V]")

ax2 = fig.add_subplot(312)
axs.append(ax2)
ax2.plot(x, y2)
ax2.set_title("V=1000sint")
ax2.set_ylabel("Voltage[V]")

ax3 = fig.add_subplot(313)
axs.append(ax3)
ax3.plot(x, y3)
ax3.set_title("V=1000000sint")
ax3.set_ylabel("Voltage[V]")

# 全ての図に対してy軸ラベルを揃える
for ax in axs:
    ax.yaxis.set_label_coords(labelx, 0.5)

fig.tight_layout()
plt.show()
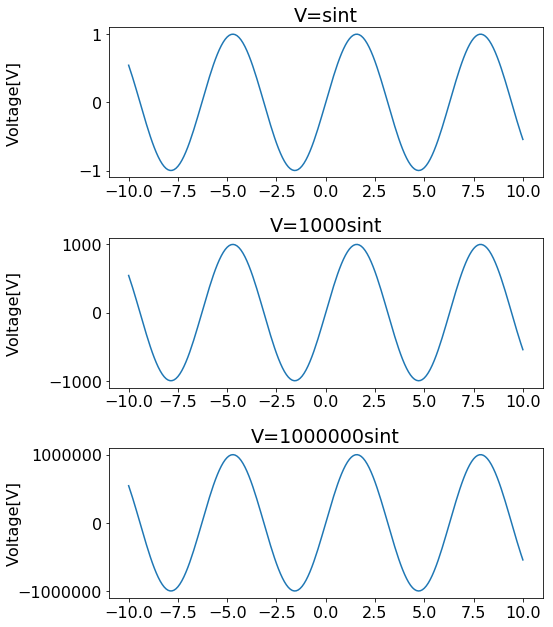
3つの図のy軸ラベルが揃いました. 一括で揃える場合には1.や2.の方法を使った方が楽ですので, 軸ラベルの位置にこだわりたい場合に使いましょう.
