tldr
KggleのAfrica Economic, Banking and Systemic Crisis DataをBanking Crisis Prediction - Data Every Day #043に沿ってやっていきます。
実行環境はGoogle Colaboratorです。
インポート
import numpy as np
import pandas as pd
import matplotlib.pyplot as plt
import seaborn as sns

import sklearn.preprocessing as sp
from sklearn.model_selection import train_test_split
import sklearn.linear_model as slm

import tensorflow as tf
データのダウンロード
Google Driveをマウントします。
from google.colab import drive
drive.mount('/content/drive')
Mounted at /content/drive
KaggleのAPIクライアントを初期化し、認証します。
認証情報はGoogle Drive内(/content/drive/My Drive/Colab Notebooks/Kaggle)にkaggle.jsonとして置いてあります。
import os
kaggle_path = "/content/drive/My Drive/Colab Notebooks/Kaggle"
os.environ['KAGGLE_CONFIG_DIR'] = kaggle_path

from kaggle.api.kaggle_api_extended import KaggleApi
api = KaggleApi()
api.authenticate()
Kaggle APIを使ってデータをダウンロードします。
dataset_id = 'chirin/africa-economic-banking-and-systemic-crisis-data'
dataset = api.dataset_list_files(dataset_id)
file_name = dataset.files[0].name
file_path = os.path.join(api.get_default_download_dir(), file_name)
file_path
'/content/african_crises.csv'
api.dataset_download_file(dataset_id, file_name, force=True, quiet=False)
100%|██████████| 65.4k/65.4k [00:00<00:00, 27.5MB/s]

Downloading african_crises.csv to /content


True
データの読み込み
Pedumagalhaes/quality-prediction-in-a-mining-processadasを使ってダウンロードしてきたCSVファイルを読み込みます。
data = pd.read_csv(file_path)
data
| case | cc3 | country | year | systemic_crisis | exch_usd | domestic_debt_in_default | sovereign_external_debt_default | gdp_weighted_default | inflation_annual_cpi | independence | currency_crises | inflation_crises | banking_crisis | |
|---|---|---|---|---|---|---|---|---|---|---|---|---|---|---|
| 0 | 1 | DZA | Algeria | 1870 | 1 | 0.052264 | 0 | 0 | 0.0 | 3.441456 | 0 | 0 | 0 | crisis |
| 1 | 1 | DZA | Algeria | 1871 | 0 | 0.052798 | 0 | 0 | 0.0 | 14.149140 | 0 | 0 | 0 | no_crisis |
| 2 | 1 | DZA | Algeria | 1872 | 0 | 0.052274 | 0 | 0 | 0.0 | -3.718593 | 0 | 0 | 0 | no_crisis |
| 3 | 1 | DZA | Algeria | 1873 | 0 | 0.051680 | 0 | 0 | 0.0 | 11.203897 | 0 | 0 | 0 | no_crisis |
| 4 | 1 | DZA | Algeria | 1874 | 0 | 0.051308 | 0 | 0 | 0.0 | -3.848561 | 0 | 0 | 0 | no_crisis |
| ... | ... | ... | ... | ... | ... | ... | ... | ... | ... | ... | ... | ... | ... | ... |
| 1054 | 70 | ZWE | Zimbabwe | 2009 | 1 | 354.800000 | 1 | 1 | 0.0 | -7.670000 | 1 | 1 | 0 | crisis |
| 1055 | 70 | ZWE | Zimbabwe | 2010 | 0 | 378.200000 | 1 | 1 | 0.0 | 3.217000 | 1 | 0 | 0 | no_crisis |
| 1056 | 70 | ZWE | Zimbabwe | 2011 | 0 | 361.900000 | 1 | 1 | 0.0 | 4.920000 | 1 | 0 | 0 | no_crisis |
| 1057 | 70 | ZWE | Zimbabwe | 2012 | 0 | 361.900000 | 1 | 1 | 0.0 | 3.720000 | 1 | 0 | 0 | no_crisis |
| 1058 | 70 | ZWE | Zimbabwe | 2013 | 0 | 361.900000 | 1 | 1 | 0.0 | 1.632000 | 1 | 0 | 0 | no_crisis |
1059 rows × 14 columns
下準備
data.info()
<class 'pandas.core.frame.DataFrame'>
RangeIndex: 1059 entries, 0 to 1058
Data columns (total 14 columns):
 #   Column                           Non-Null Count  Dtype
---  ------                           --------------  -----
 0   case                             1059 non-null   int64
 1   cc3                              1059 non-null   object
 2   country                          1059 non-null   object
 3   year                             1059 non-null   int64
 4   systemic_crisis                  1059 non-null   int64
 5   exch_usd                         1059 non-null   float64
 6   domestic_debt_in_default         1059 non-null   int64
 7   sovereign_external_debt_default  1059 non-null   int64
 8   gdp_weighted_default             1059 non-null   float64
 9   inflation_annual_cpi             1059 non-null   float64
 10  independence                     1059 non-null   int64
 11  currency_crises                  1059 non-null   int64
 12  inflation_crises                 1059 non-null   int64
 13  banking_crisis                   1059 non-null   object
dtypes: float64(3), int64(8), object(3)
memory usage: 116.0+ KB
data.isna().sum()
case                               0
cc3                                0
country                            0
year                               0
systemic_crisis                    0
exch_usd                           0
domestic_debt_in_default           0
sovereign_external_debt_default    0
gdp_weighted_default               0
inflation_annual_cpi               0
independence                       0
currency_crises                    0
inflation_crises                   0
banking_crisis                     0
dtype: int64
エンコード
data = data.drop(['case', 'country'], axis=1)
def onehot_ende(df, column):
    df = df.copy()
    dummies = pd.get_dummies(df[column])
    df = pd.concat([df, dummies], axis=1)
    df = df.drop(column, axis=1)
    return df
data = onehot_ende(data, 'cc3')
y = data['banking_crisis']
X = data.drop(['banking_crisis'], axis=1)
label_encoder = sp.LabelEncoder()
y = label_encoder.fit_transform(y)
{index: label for index, label in enumerate(label_encoder.classes_)}
{0: 'crisis', 1: 'no_crisis'}
pd.Series(y).apply(lambda x: 1 - x)
0       1
1       0
2       0
3       0
4       0
       ..
1054    1
1055    0
1056    0
1057    0
1058    0
Length: 1059, dtype: int64
スケーリング
scaler = sp.StandardScaler()
X = pd.DataFrame(scaler.fit_transform(X), index=X.index, columns=X.columns)
分割
X_train, X_test, y_train, y_test = train_test_split(X, y, train_size=0.7)
Training
X_train.shape
(741, 23)
model = tf.keras.Sequential([
    tf.keras.layers.Dense(64, activation='relu', input_shape=(23,)),
    tf.keras.layers.Dense(64, activation='relu'),
    tf.keras.layers.Dense(1, activation='sigmoid'),
])

model.summary()

model.compile(
    optimizer='adam',
    loss='binary_crossentropy',
    metrics=[tf.keras.metrics.AUC(name='auc')],
)

batch_size = 64
epochs = 60

history = model.fit(
    X_train,
    y_train,
    validation_split=0.2,
    batch_size=batch_size,
    epochs=epochs,
    callbacks=[tf.keras.callbacks.ReduceLROnPlateau()],
    verbose=0,
)
Model: "sequential_2"
_________________________________________________________________
Layer (type)                 Output Shape              Param #
=================================================================
dense_6 (Dense)              (None, 64)                1536
_________________________________________________________________
dense_7 (Dense)              (None, 64)                4160
_________________________________________________________________
dense_8 (Dense)              (None, 1)                 65
=================================================================
Total params: 5,761
Trainable params: 5,761
Non-trainable params: 0
_________________________________________________________________
結果
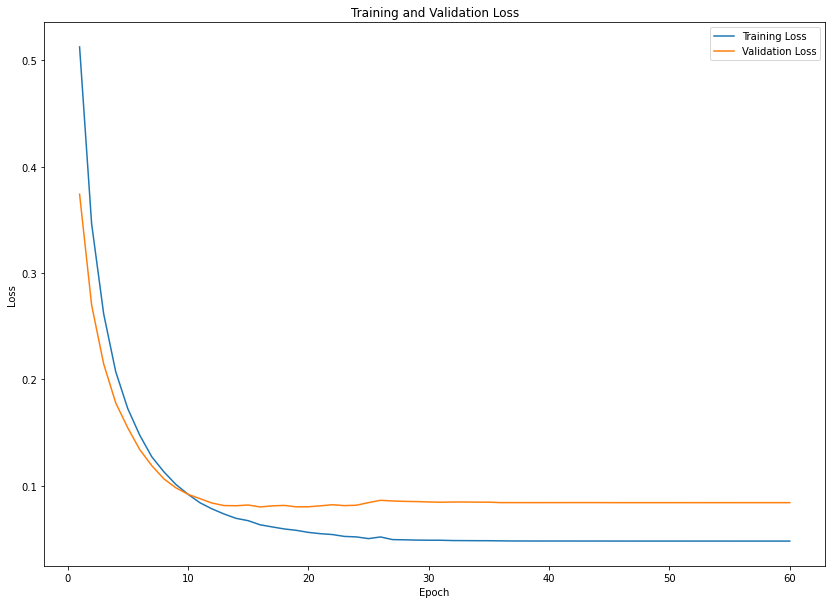
plt.figure(figsize=(14, 10))

epochs_range = range(1, epochs+1)
train_loss = history.history['loss']
val_loss = history.history['val_loss']

plt.plot(epochs_range, train_loss, label='Training Loss')
plt.plot(epochs_range, val_loss, label='Validation Loss')

plt.title('Training and Validation Loss')
plt.xlabel('Epoch')
plt.ylabel('Loss')
plt.legend()

plt.show()
model.evaluate(X_test, y_test)
10/10 [==============================] - 0s 3ms/step - loss: 0.0758 - auc: 0.9855


[0.07584450393915176, 0.9855029582977295]