tldr
KggleのStudents' Academic Performance DatasetをPredicting Performance in School - Data Every Day #046に沿ってやっていきます。
実行環境はGoogle Colaboratorです。
インポート
import numpy as np
import pandas as pd
import matplotlib.pyplot as plt
import seaborn as sns

import sklearn.preprocessing as sp
from sklearn.model_selection import train_test_split
import sklearn.linear_model as slm

import tensorflow as tf
データのダウンロード
Google Driveをマウントします。
from google.colab import drive
drive.mount('/content/drive')
Mounted at /content/drive
KaggleのAPIクライアントを初期化し、認証します。
認証情報はGoogle Drive内(/content/drive/My Drive/Colab Notebooks/Kaggle)にkaggle.jsonとして置いてあります。
import os
kaggle_path = "/content/drive/My Drive/Colab Notebooks/Kaggle"
os.environ['KAGGLE_CONFIG_DIR'] = kaggle_path

from kaggle.api.kaggle_api_extended import KaggleApi
api = KaggleApi()
api.authenticate()
Kaggle APIを使ってデータをダウンロードします。
dataset_id = 'aljarah/xAPI-Edu-Data'
dataset = api.dataset_list_files(dataset_id)
file_name = dataset.files[0].name
file_path = os.path.join(api.get_default_download_dir(), file_name)
file_path
'/content/xAPI-Edu-Data.csv'
api.dataset_download_file(dataset_id, file_name, force=True, quiet=False)
100%|██████████| 37.1k/37.1k [00:00<00:00, 19.1MB/s]

Downloading xAPI-Edu-Data.csv to /content


True
データの読み込み
data = pd.read_csv(file_path)
data
| gender | NationalITy | PlaceofBirth | StageID | GradeID | SectionID | Topic | Semester | Relation | raisedhands | VisITedResources | AnnouncementsView | Discussion | ParentAnsweringSurvey | ParentschoolSatisfaction | StudentAbsenceDays | Class | |
|---|---|---|---|---|---|---|---|---|---|---|---|---|---|---|---|---|---|
| 0 | M | KW | KuwaIT | lowerlevel | G-04 | A | IT | F | Father | 15 | 16 | 2 | 20 | Yes | Good | Under-7 | M |
| 1 | M | KW | KuwaIT | lowerlevel | G-04 | A | IT | F | Father | 20 | 20 | 3 | 25 | Yes | Good | Under-7 | M |
| 2 | M | KW | KuwaIT | lowerlevel | G-04 | A | IT | F | Father | 10 | 7 | 0 | 30 | No | Bad | Above-7 | L |
| 3 | M | KW | KuwaIT | lowerlevel | G-04 | A | IT | F | Father | 30 | 25 | 5 | 35 | No | Bad | Above-7 | L |
| 4 | M | KW | KuwaIT | lowerlevel | G-04 | A | IT | F | Father | 40 | 50 | 12 | 50 | No | Bad | Above-7 | M |
| ... | ... | ... | ... | ... | ... | ... | ... | ... | ... | ... | ... | ... | ... | ... | ... | ... | ... |
| 475 | F | Jordan | Jordan | MiddleSchool | G-08 | A | Chemistry | S | Father | 5 | 4 | 5 | 8 | No | Bad | Above-7 | L |
| 476 | F | Jordan | Jordan | MiddleSchool | G-08 | A | Geology | F | Father | 50 | 77 | 14 | 28 | No | Bad | Under-7 | M |
| 477 | F | Jordan | Jordan | MiddleSchool | G-08 | A | Geology | S | Father | 55 | 74 | 25 | 29 | No | Bad | Under-7 | M |
| 478 | F | Jordan | Jordan | MiddleSchool | G-08 | A | History | F | Father | 30 | 17 | 14 | 57 | No | Bad | Above-7 | L |
| 479 | F | Jordan | Jordan | MiddleSchool | G-08 | A | History | S | Father | 35 | 14 | 23 | 62 | No | Bad | Above-7 | L |
480 rows × 17 columns
下準備
data.info()
<class 'pandas.core.frame.DataFrame'>
RangeIndex: 480 entries, 0 to 479
Data columns (total 17 columns):
 #   Column                    Non-Null Count  Dtype
---  ------                    --------------  -----
 0   gender                    480 non-null    object
 1   NationalITy               480 non-null    object
 2   PlaceofBirth              480 non-null    object
 3   StageID                   480 non-null    object
 4   GradeID                   480 non-null    object
 5   SectionID                 480 non-null    object
 6   Topic                     480 non-null    object
 7   Semester                  480 non-null    object
 8   Relation                  480 non-null    object
 9   raisedhands               480 non-null    int64
 10  VisITedResources          480 non-null    int64
 11  AnnouncementsView         480 non-null    int64
 12  Discussion                480 non-null    int64
 13  ParentAnsweringSurvey     480 non-null    object
 14  ParentschoolSatisfaction  480 non-null    object
 15  StudentAbsenceDays        480 non-null    object
 16  Class                     480 non-null    object
dtypes: int64(4), object(13)
memory usage: 63.9+ KB
def get_uniques(df, columns):
    return {column: list(df[column].unique()) for column in columns}

def get_categorical_columns(df):
    return [column for column in df.columns if df.dtypes[column] == 'object']
get_uniques(data, get_categorical_columns(data))
{'Class': ['M', 'L', 'H'],
 'GradeID': ['G-04',
  'G-07',
  'G-08',
  'G-06',
  'G-05',
  'G-09',
  'G-12',
  'G-11',
  'G-10',
  'G-02'],
 'NationalITy': ['KW',
  'lebanon',
  'Egypt',
  'SaudiArabia',
  'USA',
  'Jordan',
  'venzuela',
  'Iran',
  'Tunis',
  'Morocco',
  'Syria',
  'Palestine',
  'Iraq',
  'Lybia'],
 'ParentAnsweringSurvey': ['Yes', 'No'],
 'ParentschoolSatisfaction': ['Good', 'Bad'],
 'PlaceofBirth': ['KuwaIT',
  'lebanon',
  'Egypt',
  'SaudiArabia',
  'USA',
  'Jordan',
  'venzuela',
  'Iran',
  'Tunis',
  'Morocco',
  'Syria',
  'Iraq',
  'Palestine',
  'Lybia'],
 'Relation': ['Father', 'Mum'],
 'SectionID': ['A', 'B', 'C'],
 'Semester': ['F', 'S'],
 'StageID': ['lowerlevel', 'MiddleSchool', 'HighSchool'],
 'StudentAbsenceDays': ['Under-7', 'Above-7'],
 'Topic': ['IT',
  'Math',
  'Arabic',
  'Science',
  'English',
  'Quran',
  'Spanish',
  'French',
  'History',
  'Biology',
  'Chemistry',
  'Geology'],
 'gender': ['M', 'F']}
binary_feayures = ['gender', 'Semester', 'Relation', 'ParentAnsweringSurvey', 'ParentschoolSatisfaction', 'StudentAbsenceDays']
ordianl_features = ['StageID', 'GradeID']
nominal_features = ['NationalITy', 'PlaceofBirth', 'SectionID', 'Topic']

target_column = 'Class'
binary_positive = ['M', 'S', 'Father', 'Yes', 'Good', 'Above-7']
stage_ordering = ['lowerlevel', 'MiddleSchool', 'HighSchool']
grade_ordering = [
    'G-02',
    'G-04',
    'G-05',
    'G-06',
    'G-07',
    'G-08',
    'G-09',
    'G-10',
    'G-11',
    'G-12',
]

nominal_prefixes = ['N', 'B', 'S', 'T']
def binary_encode(df, column, positive_value):
    df = df.copy()
    df[column] = df[column].apply(lambda x: 1 if x == positive_value else 0)
    return df

def ordinal_encode(df, column, ordering):
    df = df.copy()
    df[column] = df[column].apply(lambda x: ordering.index(x))
    return df

def onehot_encode(df, column, prefix):
    df = df.copy()
    dummies = pd.get_dummies(df[column], prefix=prefix)
    df = pd.concat([df, dummies], axis=1)
    df = df.drop(column, axis=1)
    return df
for feature, positive_value in zip(binary_feayures, binary_positive):
    data = binary_encode(data, feature, positive_value)
data = ordinal_encode(data, 'StageID', stage_ordering)
data = ordinal_encode(data, 'GradeID', grade_ordering)
for feature, prefix in zip(nominal_features, nominal_prefixes):
    data = onehot_encode(data, feature, prefix)
target_ordering = ['L', 'M', 'H']
data = ordinal_encode(data, target_column, target_ordering)
分割とスケーリング
y = data[target_column]
X = data.drop([target_column], axis=1)
scaler = sp.StandardScaler()
X = scaler.fit_transform(X)
X_train, X_test, y_train, y_test = train_test_split(X, y, train_size=0.8)
トレーニング
X.shape
(480, 55)
model = tf.keras.Sequential([
    tf.keras.layers.Dense(64, activation='relu', input_shape=(55,)),
    tf.keras.layers.Dense(64, activation='relu'),
    tf.keras.layers.Dense(3, activation='softmax'),
])

model.summary()

model.compile(
    optimizer='adam',
    loss='sparse_categorical_crossentropy',
    metrics=['accuracy'],
)

batch_size = 64
epochs = 100

history = model.fit(
    X_train,
    y_train,
    validation_split=0.2,
    batch_size=batch_size,
    epochs=epochs,
    verbose=0,
)
Model: "sequential_4"
_________________________________________________________________
Layer (type)                 Output Shape              Param #
=================================================================
dense_12 (Dense)             (None, 64)                3584
_________________________________________________________________
dense_13 (Dense)             (None, 64)                4160
_________________________________________________________________
dense_14 (Dense)             (None, 3)                 195
=================================================================
Total params: 7,939
Trainable params: 7,939
Non-trainable params: 0
_________________________________________________________________
plt.figure(figsize=(14, 10))

epochs_range = range(1, epochs+1)
train_loss = history.history['loss']
val_loss = history.history['val_loss']

plt.plot(epochs_range, train_loss, label='Training Loss')
plt.plot(epochs_range, val_loss, label='Validation Loss')

plt.title('Training and Validation Loss')
plt.xlabel('Epoch')
plt.ylabel('Loss')
plt.legend()

plt.show()
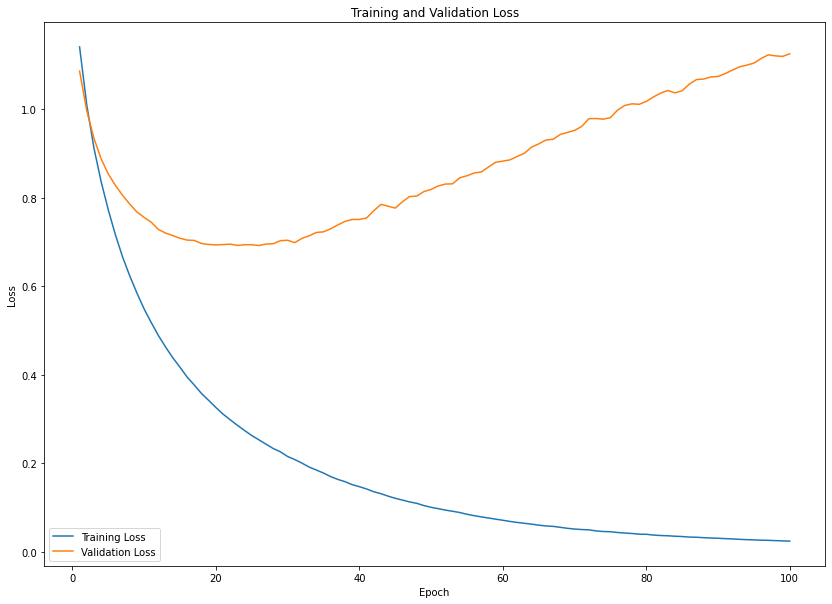
np.argmin(val_loss)
25