matplotlibは、figureやsubplotなどなどがどう働いているのかが分かりにくい。
そこで、ここでは、matplotlibの描画の構造について説明する。
これ以降、matplotlib.pyplotをpltとしてimportしているとする。
import matplotlib.pyplot as plt
plt.figure()
plt.figure()が最初に出てくることが多い。figure()はFigureインスタンスを作成する。
Figureインスタンスは、描画全体の領域を確保する。
引数では以下を指定できる。
- figsize: (width, height)のタプルを渡す。単位はインチ。
- dpi: 1インチあたりのドット数。
- facecolor: 背景色
- edgecolor: 枠線の色
plt.figure()では描画領域の確保だけなので、グラフは何も描画されない。
fig.add_subplot()
plt.figure()にグラフを描画するためにsubplotを追加する必要がある。
subplotの追加は、add_subplotメソッドを使用する。
fig = plt.figure()
fig.add_subplot(111)
これで以下のように軸などのグラフの描画領域が追加される。
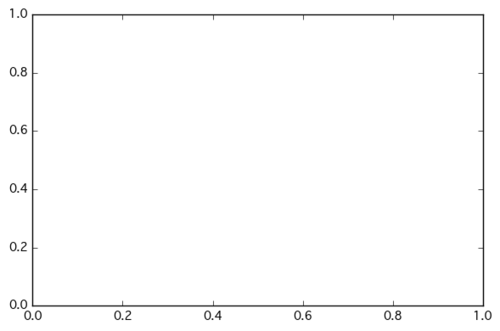
111の意味は、1行目1列の1番目という意味で、subplot(1,1,1)でも同じである。
subplotはAxesオブジェクトを返す。
Axesは、グラフの描画、軸のメモリ、ラベルの設定などを請け負う。
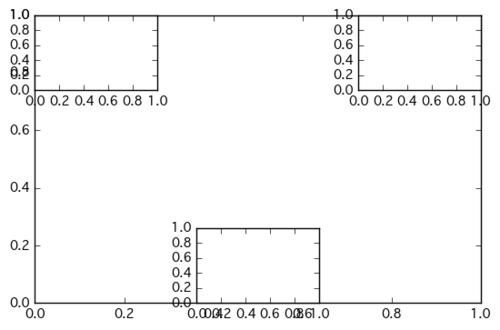
add_subplotは基本的に上書きとなる。以下は、どういう構成化わかりすくするために、わざと上書きしたもの。
fig = plt.figure()
fig.add_subplot(1, 1, 1)
fig.add_subplot(3, 3, 1)   # 3x3の1つめ(左上)
fig.add_subplot(3, 3, 3)   # 3x3の3つめ(右上)
fig.add_subplot(3, 3, 8)   # 3x3の8つめ(真ん中下)
plt.subplot()
plt.subplot()はadd_subplotと同様に、引数に行数列数及び何番目かを指定できる。
add_subplotとの違いは、現在の描画領域(fig = figure()のこと)に追加するメソッドであるということ。
あまりないと思うが、figure()を何個も立ち上げてるときに、どれを操作しているかわかりにくくなる。
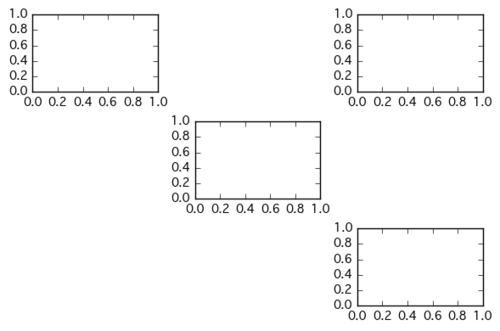
plt.subplot(3,3,1)
plt.subplot(3,3,3)
plt.subplot(3,3,5)
plt.subplot(3,3,9)
subplotはsubplot以前に描画していたfigureとかぶった場合、前のfigureを消す性質を持っている。
plt.plot([1,2,3])
plt.subplot(211)   # このタイミングで plt.plot([1,2,3]) は消されてしまう。
plt.plot(range(12))
plt.subplot(212)
plt.subplots()
plt.subplot()と似たものとしてplt.subplots()もある。
返り値はfigとAxesまたはAxesオブジェクトの配列。
plt.subplots()は実は、fig = figure()をした後、fig.add_subplot(111)した場合と同じである。
subplots()も、add_subplotの場合と同様にAxesオブジェクトを返す。
fig = plt.figure()
plt.add_subplot(111)
plt.subplots()の引数に行数列数を与えることで、複数のAxesオブジェクトを生成できる。
fig, axes= plt.subplots(2,2)   # axesはAxesオブジェクトの2x2の配列
axes[0][0].plot([1,2,3])
axes[1][0].plot([4,5,4,5])
上記スクリプトの出力結果は以下のようになる。
Axes
Axesオブジェクトは、実際のデータの描画の役割を持っている。
Axesオブジェクトに対して描画するデータを与えたり、set_xlabel、set_ylabel、set_titleで
ラベルやタイトルの設定をできる。
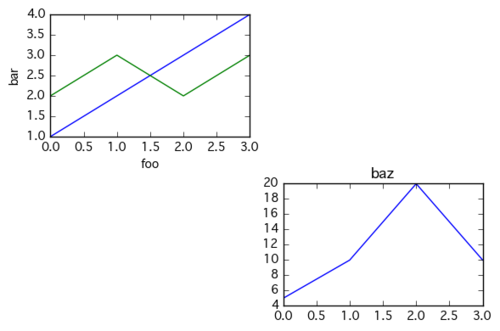
また、同じAxesオブジェクトにplotを重ねることもできる。
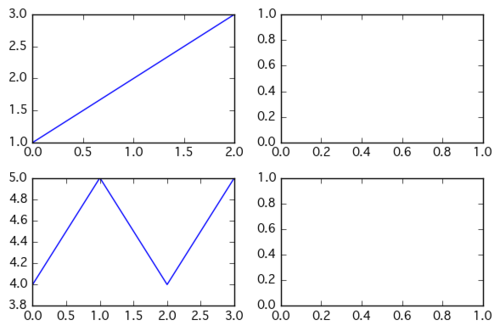
ax1 = plt.subplot(2,2,1)   # 4x4の1番目
ax4 = plt.subplot(2,2,4)   # 4x4の4番目
ax1.plot([1,2,3,4])   # 1番目に描画
ax1.plot([2,3,2,3])   # 1番目に追加描画
ax1.set_xlabel('foo')   # 1番目にxラベルを追加
ax1.set_ylabel('bar')   # 1番目にyラベルを追加
ax4.plot([5,10,20,10])   # 4番目に描画
ax4.set_title('baz')   # 4番目にタイトルを追加
plt.title()、plt.xlabel()、plt.ylabel()
グラフを1つずつ描画しているときは、plt.title()、plt.xlabel()、plt.ylabel()をよく使うのだが、
結局これは何かというと、ax = subplot(111)にたいして、ax.set_title()、ax.set_xlabel()、ax.set_ylabel()
とやっていることと同じとなる。
plt.gcf()
figureをたくさん立ち上げているとどのfigureにいるかわからなくなることがある。
現在のfigureを確認するためにはplt.gcf()を使う。gcfはget current figureの略。
以下の例ではそれぞれplt.gcf()の出力結果が変わることが分かる。
fig1 = plt.figure()
print(plt.gcf().number)   # => 1
fig2 = plt.figure()
print(plt.gcf().number)   # => 2
plt.close()
print(plt.gcf().number)   # => 1
plt.gca()
plt.gcf()と似た関数でplt.gca()がある。
これは、現在のAxesオブジェクトを返す。
ax = subplot(111)でやらずにあとからAxesオブジェクトを変数に定義できる。
plt.subplot(111)
ax = plt.gca()