これはNew Relic Advent Calendar 2019の23日の記事です。
New Relic 初心者です。
今回、ちょっとNew Relicを触る機会がありまして、
よく使うAWSのサービスの1つであるAWS Lambdaの監視を試してみました。
基本的には、
サーバーレス機能の監視 » AWS Lambda監視 » 始めてみましょう AWS LambdaのNew Relic監視の概要
を実施したものになります。
準備
にある通り、CloudwatchのログをNew Relicに転送するためのLambdaを設定します。
有効化するスクリプトをダウンロードして、実行します。
https://github.com/newrelic/nr-lambda-onboarding/archive/master.zip
ちなみに、日本語ページだと、Python2.6.6が必須要件になってますが、
上記ファイルをダウンロードして実行すると、
Python3が必要と言われて、エラーになります。
こちらに関しては、英語ページの記載が正しいようです。
必須要件は Python 3.3 or higher
実行コマンドは pip3 install newrelic-lambda-cli
コマン実行の際、アカウントID、リンクするアカウント名、そのアカウントで発行するAPIキーが必要になりますので、
APIキーについては、アカウント設定画面(アカウントのドロップダウン -> Account settings -> Account -> Users and roles.)で発行しておきましょう。
Lambda準備
Node.jsで書くことが多い(9割ぐらいかな)ので、Serverless FrameworkとNewRelic謹製のLambda Layer追加を実施。
オプション#1:Serverless Frameworkプラグイン(Node.jsおよびPython)を使用してください
オプション#2: 当社のLambda Layer(Node.jsおよびPython)を手動で追加
ちなみに、
英語だと、「Option #3: Manually add our Lambda Layer (Node.js and Python)」 が増えてますね。
Step 2. Install instrumentation
Option #1: Use Serverless Framework plugin (Node.js and Python)
Option #2: Add Lambda Layer with our CLI (Node.js and Python)
Option #3: Manually add our Lambda Layer (Node.js and Python)
Option #4: Manually instrument Lambda code (all available languages)
自前でLambda Layerを作ってというケースは少ないような気がするので、なくても大丈夫そうです。
両方とも試してみましたが、最終的にはServerless Framworkで、謹製のLambda Layerを追加をする形に落ち着きました。
以下抜粋
service: new-relic-test-with-dynamodb

provider:
  name: aws
  runtime: nodejs12.x
  logs:
    restApi: true
  stage: dev
  region: ap-northeast-1

custom:
  defaultStage: dev
  newRelic:
    accountId: 1234567
functions:
  index:
    handler: newrelic-lambda-wrapper.handler
    environment:
      NEW_RELIC_ACCOUNT_ID: ${self:custom.newRelic.accountId}
      NEW_RELIC_LAMBDA_HANDLER: handler.index
    memorySize: 256
    timeout: 25
    layers:
      - arn:aws:lambda:ap-northeast-1:451483290750:layer:NewRelicNodeJS12X:3
    events:
      - http:
          method: any
          path: /api
          integration: lambda-proxy
最初ハンドラーの指定の意味がわかってなくて、ちゃんとドキュメント読め事案でした。
Layerで、ログを取得する対象のLambdaをラッパーしてるんですね。ふむふむ。
最後に、
「ステップ3。CloudWatchログを設定し、New Relic Lambdaへのストリーミングを行う」
をやるんですが、忘れて、データ来ないなーと思ったことが数回。すみません。
作ったLambda自体は、DynamoDBへの参照・更新を行う単純なものです。
Node.js v12.xランタイムで実行確認してます。
あ、エラー起きた時にどーなるか知りたかったので、乱数生成して、特定の数値の時に、異常終了するようにしてます。
'use strict';
console.log('Loading function...');

const AWS = require('aws-sdk');
const dynamo = new AWS.DynamoDB.DocumentClient({
  region: 'ap-northeast-1'
});
const Crypto = require('crypto');

const successMessage = 'Success!'
const failureMessage = 'Failure...'

module.exports.index = async (event, context) => {
  console.log('Received event:', JSON.stringify(event, null, 2));
  console.log('Received context:', JSON.stringify(context, null, 2));

  console.log('httpMethod :', event.httpMethod);
  let message;
  let results;
  const body = JSON.parse(event.body);

  const randomInt = Math.round(Math.random() * 100, 0);
  if ((randomInt % 5) === 0) {
    return randomInt / randomInt2;
  } else {
    switch (event.httpMethod) {
        case 'DELETE':
          const resDel = await deleteItem(body)
          if (resDel) {
            message = successMessage
          } else {
            message = failureMessage
          }
          break;
        case 'GET':
          const resGet = await getItem()
          if (resGet !== null) {
            results = resGet;
            message = successMessage
          } else {
            message = failureMessage
          }
          break;
        case 'POST':
          console.log('POST body :', body  );
          const resPost = await updateItem(body)
          if (resPost) {
            message = successMessage
          } else {
            message = failureMessage
          }
          break;
        case 'PUT':
          console.log('PUT body :', body  );
          const resPut = await insertItem(body)
          if (resPut) {
            message = successMessage
          } else {
            message = failureMessage
          }
          break;
        default:
          console.log(`Unsupported method "${event.httpMethod}"`);
    }
    const returnObj = {
      message,
      results,
    }
    const response = {
      statusCode: 200,
      body: JSON.stringify(
        returnObj,
        null,
        2
      ),
    };
    return response;
  }
};
async function getItem() {
  const params = {
    TableName: process.env['DYNAMO_DB_TABLE']
  }
  try {
    const result = await dynamo.scan(params).promise();
    console.log(result);
    return result["Items"];
  } catch (error) {
    console.error(error);
    return null;
  }
}
async function deleteItem(body) {
  const params = {
    TableName: process.env['DYNAMO_DB_TABLE'],
    Item: {
      'id' : body.id
    }
  }
  try {
    const result = await dynamo.delete(params).promise();
    console.log('deleteItem Success: ', result);
    return true;
  } catch (error) {
    console.error('deleteItem Error: ', error);
    return false;
  }
}
async function insertItem(body) {
  const params = {
    TableName: process.env['DYNAMO_DB_TABLE'],
    Item: {
      'id' : body.id,
      'name': body.name
    }
  }
  try {
    const result = await dynamo.put(params).promise();
    console.log('insertItem Success: ', result);
    return true;
  } catch (error) {
    console.error('insertItem Error: ', error);
    return false;
  }
}
async function updateItem(body) {
  const params = {
    TableName: process.env['DYNAMO_DB_TABLE'],
    Item: {
      'id' : body.id,
      'name': body.name
    }
  }
  try {
    const result = await dynamo.update(params).promise();
    console.log('updateItem Success: ', result);
    return true;
  } catch (error) {
    console.error('updateItem Error: ', error);
    return false;
  }
}
実行およびNew Relic上での確認
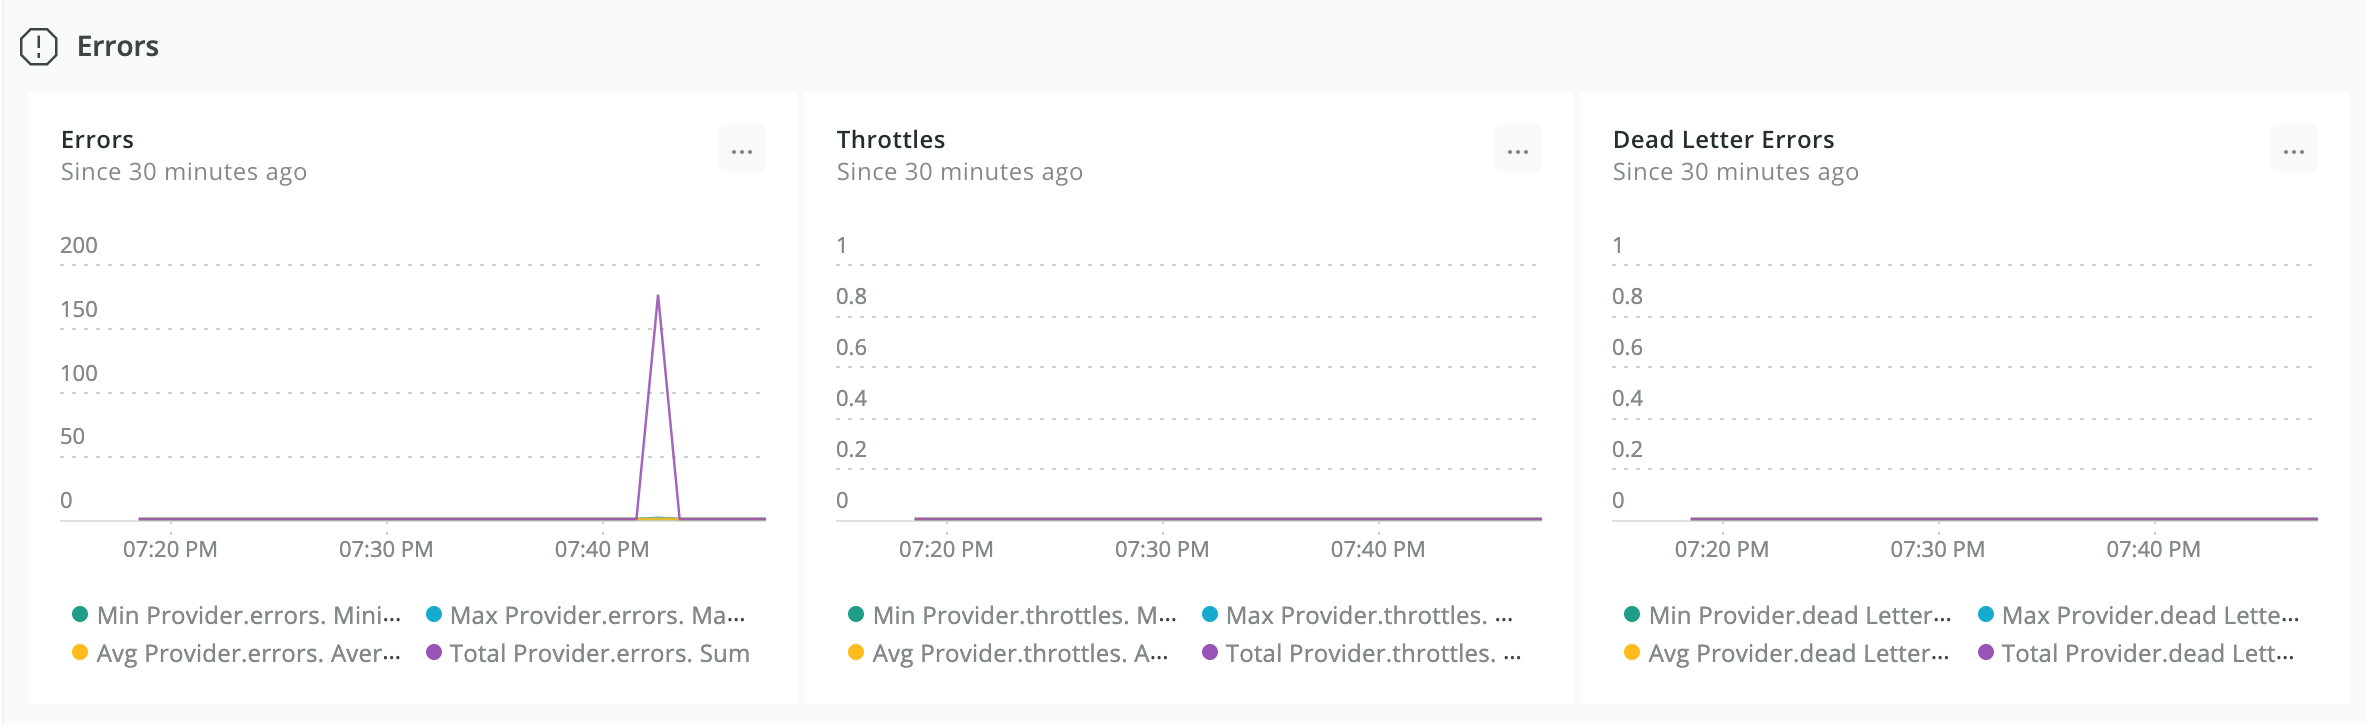
検証としては、Apache Benchで10並列1000リクエストのリクエストを投げています。画面サンプルはそれを2回投げた結果
https://one.newrelic.com/ でログインして、
Entity Explorer -> Lambda Functions -> 設定したLambda -> Summary を開きます。
2回ほどABでリクエスト投げた結果です。


そういえば、エラーレートが出てないんですけど、なんでかなーって感じです。
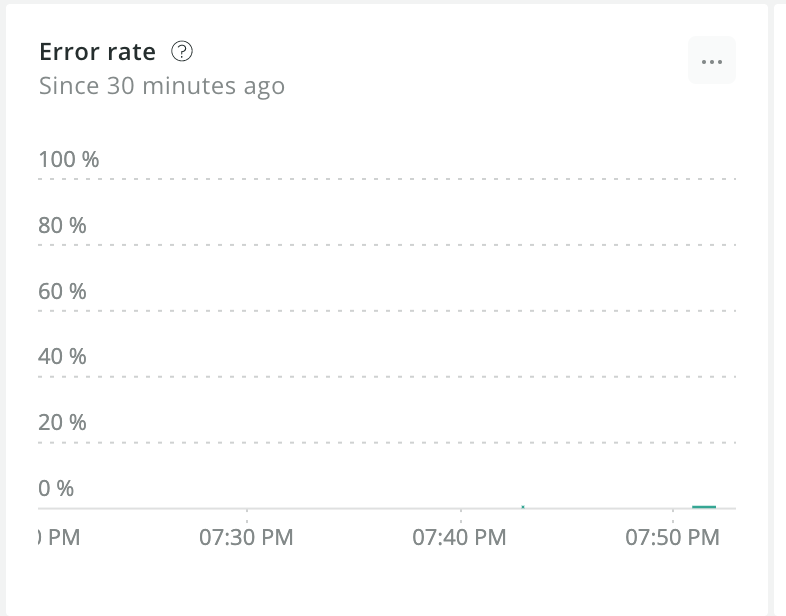
メトリクス上は送られてきている(Summaryの下にあるCloudwatch Metricsで確認できます)ので、
計算式がおかしいか、もっとエラーが多くないとダメなのかもしれません。。。
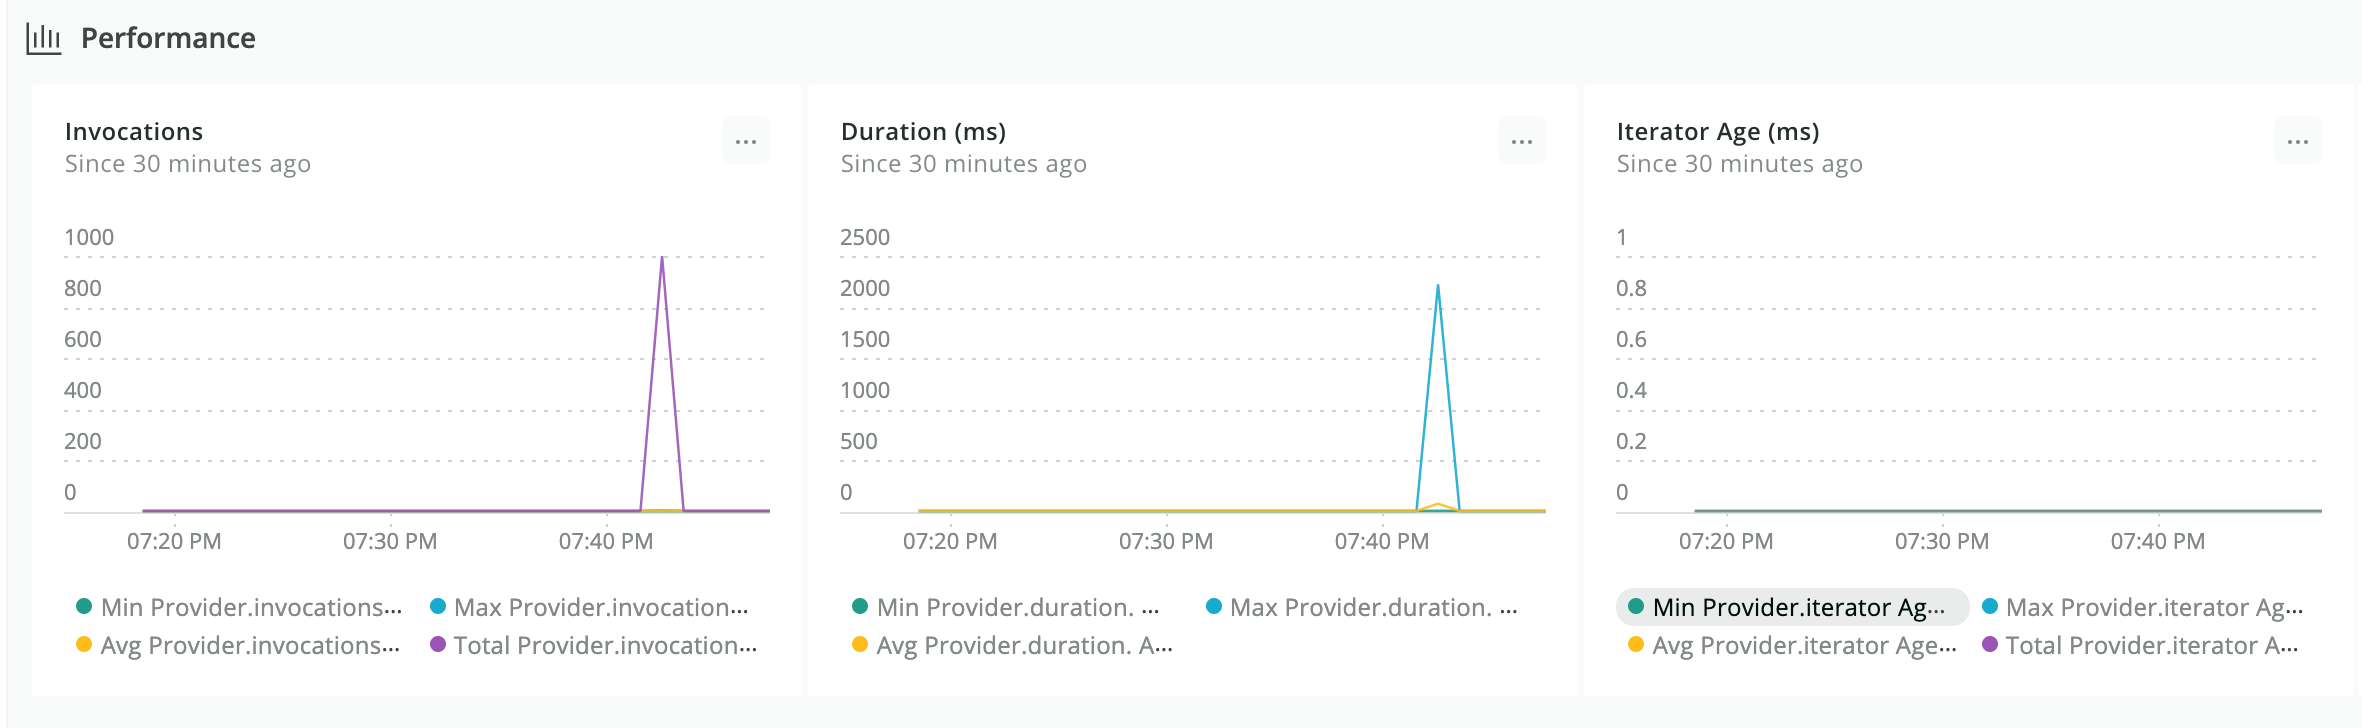
細かいところまではみれていませんが、所感としては、
1つのLambdaについて、各種情報が数値、グラフ織り交ぜて、見れるのがいいですね。
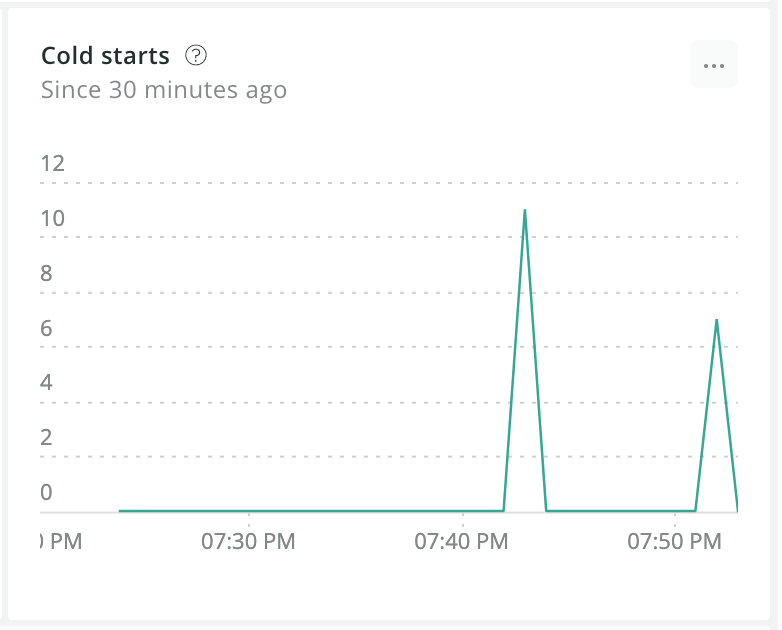
個人的には、ColdStartが可視化されているのは評価高いです。
Cloudwatch Logsのログストリームをみれば、わかるんですが、
お、こんだけLambda起動したんか!っていうのがビジュアル的にわかるのは嬉しいです。
そういえば、
「Provisioned Concurrency for Lambda Functions」を設定したLambdaだと、この辺どうなるんでしょうかね。検証できたらします。
今後
Lambdaのエラーの内容監視やDynamoDB自体の監視もできるようなんですが、
Infrastructureサブスクリプションの購入が必要なようなので、今度できたらやってみたいですね。
あと、通知って飛ばせるのかな?ってところまでみてないので、機会があればやってみたいところ
最後に
検証し始めてから、設定したAWSアカウントのCloudwatchの利用料金が上がっているのは、Datadogでも結構あがっていたので、
監視サービス使う上ではしょうがないでしょうかねと思う今日この頃。
初心者なりに頑張ってみましたが、
乱筆乱文のほど、どうぞお許しください。
また、ここ違うんじゃというご指摘お待ちしております。