はじめに
qiita初投稿です。以前から自然言語処理に興味があって触ってみようと言う事で、自分の好きな歌手の曲の歌詞、人気top10とあまり人気のないtop10をスクレイピング→形態解析→頻度の抽出→グラフ化してどのような違いが出るのか見てみました。
使用したサイト
Uta-Net
https://www.uta-net.com/
スクレイピング
import requests
from bs4 import BeautifulSoup
from janome.tokenizer import Tokenizer
import collections

t = Tokenizer()

# 指定したurlのhtmlから歌詞を抽出
r = requests.get("歌詞ページのURL")
soup = BeautifulSoup(r.content, "html.parser")
kashi = soup.find(id = "kashi_area").text

# 名詞の出現頻度の抽出
kashi = collections.Counter(token.base_form for token in t.tokenize(kashi)if token.part_of_speech.startswith('名詞'))
上記で歌詞を解析し得た出現頻度データをDBに格納
グラフ化
import numpy as np
import matplotlib.pyplot as plt
import songdef as s
import japanize_matplotlib

top_x = []
top_y = []

last_x = []
last_y = []

all_x = []
all_y = []

# DBからデータを持ってくる
d_top = s.get_date("top_song")#DBから抽出したデータを持ってくるメソッド
d_top = s.sort_del(d_top)#データをlist型に変換し頻度の高い順にソートし、top10以下を切り捨てるメソッド

d_last = s.get_date("last_song")
d_last = s.sort_del(d_last)

d_all = s.get_date("all_song")
d_all = s.sort_del2(d_all)


# x,yのデータの用意
for res in d_top:
    best_x.append(res)
    best_y.append(d_top[res])

for res in d_last:
    normal_x.append(res)
    normal_y.append(d_last[res])

for res in d_all:
    all_x.append(res)
    all_y.append(d_all[res])


# Figureを作成
fig = plt.figure(facecolor = "lightgray", figsize = (20,15))
fig2 = plt.figure(facecolor = "lightgray", figsize = (40,15))

# FigureにAxesを追加
ax_1 = fig.add_subplot(221)
ax_2 = fig.add_subplot(222)
ax_3 = fig2.add_subplot(223)


# Axesの設定
ax_1.set_title("top10_song", fontsize = 14)
ax_1.set_xlabel("word", fontsize = 14)
ax_1.set_ylabel("count", fontsize = 14)

ax_2.set_title("last10_song", fontsize = 14)
ax_2.set_xlabel("word", fontsize = 14)
ax_2.set_ylabel("count", fontsize = 14)

ax_3.set_title("all_song", fontsize = 14)
ax_3.set_xlabel("word", fontsize = 14)
ax_3.set_ylabel("count", fontsize = 14)

# Axesに棒グラフを追加
ax_1.bar(top_x,top_y)
ax_2.bar(last_x,last_y)
ax_3.bar(all_x,all_y)
Jupyterで上記コードでグラフ化した結果、、、
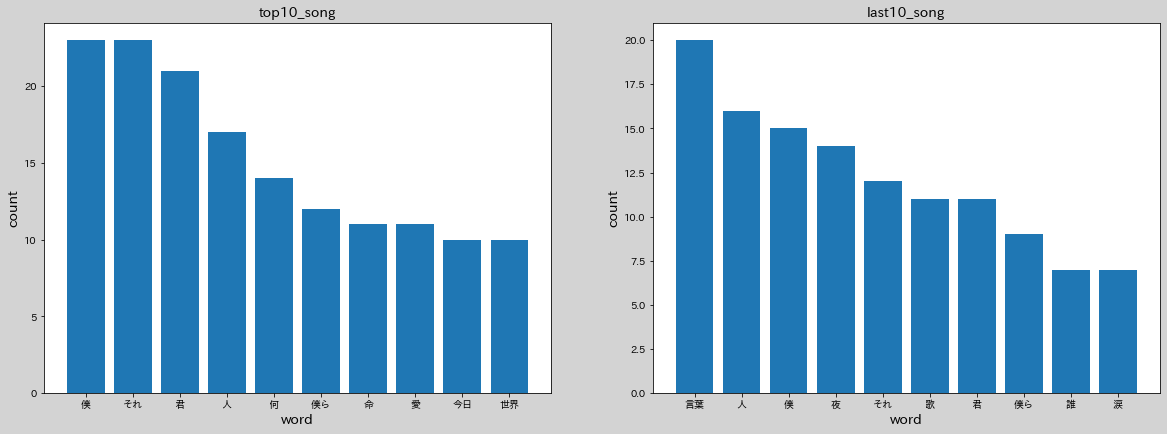
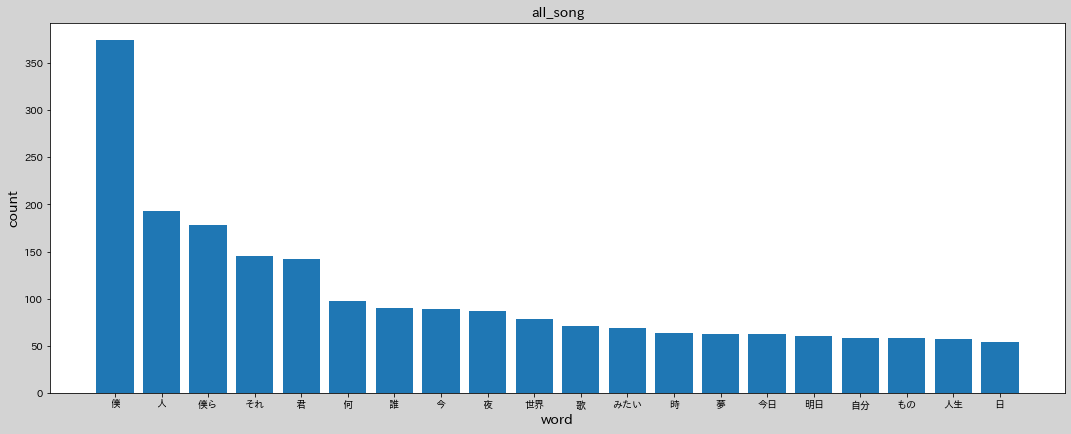
こんな感じになりました!ちなみにall_songは対象のアーティスト全曲のデータです。top10、last10との割合を見るために追加しました。
結果
top10とlast10、違いはあれど出現している単語はほぼ同じ、全曲と比較しても両方とも同じ単語がみて取れます。違いを見るというよりもそのアーティストの特徴がみられる感じでした。
と言う事で今度は曲のジャンル事に比較してみたらどのような特徴があるのかをみてみようと思います。