はじめに
HEREでエンジニアをしておりますkekishidaです。
今回はちょっとしだデータ分析におすすめのクラスタリング分析機能を実装します。
前回の記事では、HEREの地図をReactコンポーネント化しました。
今回も前回使用したReactコンポーネントを使用してそれを拡張していきます。
クラスタリング分析とは?
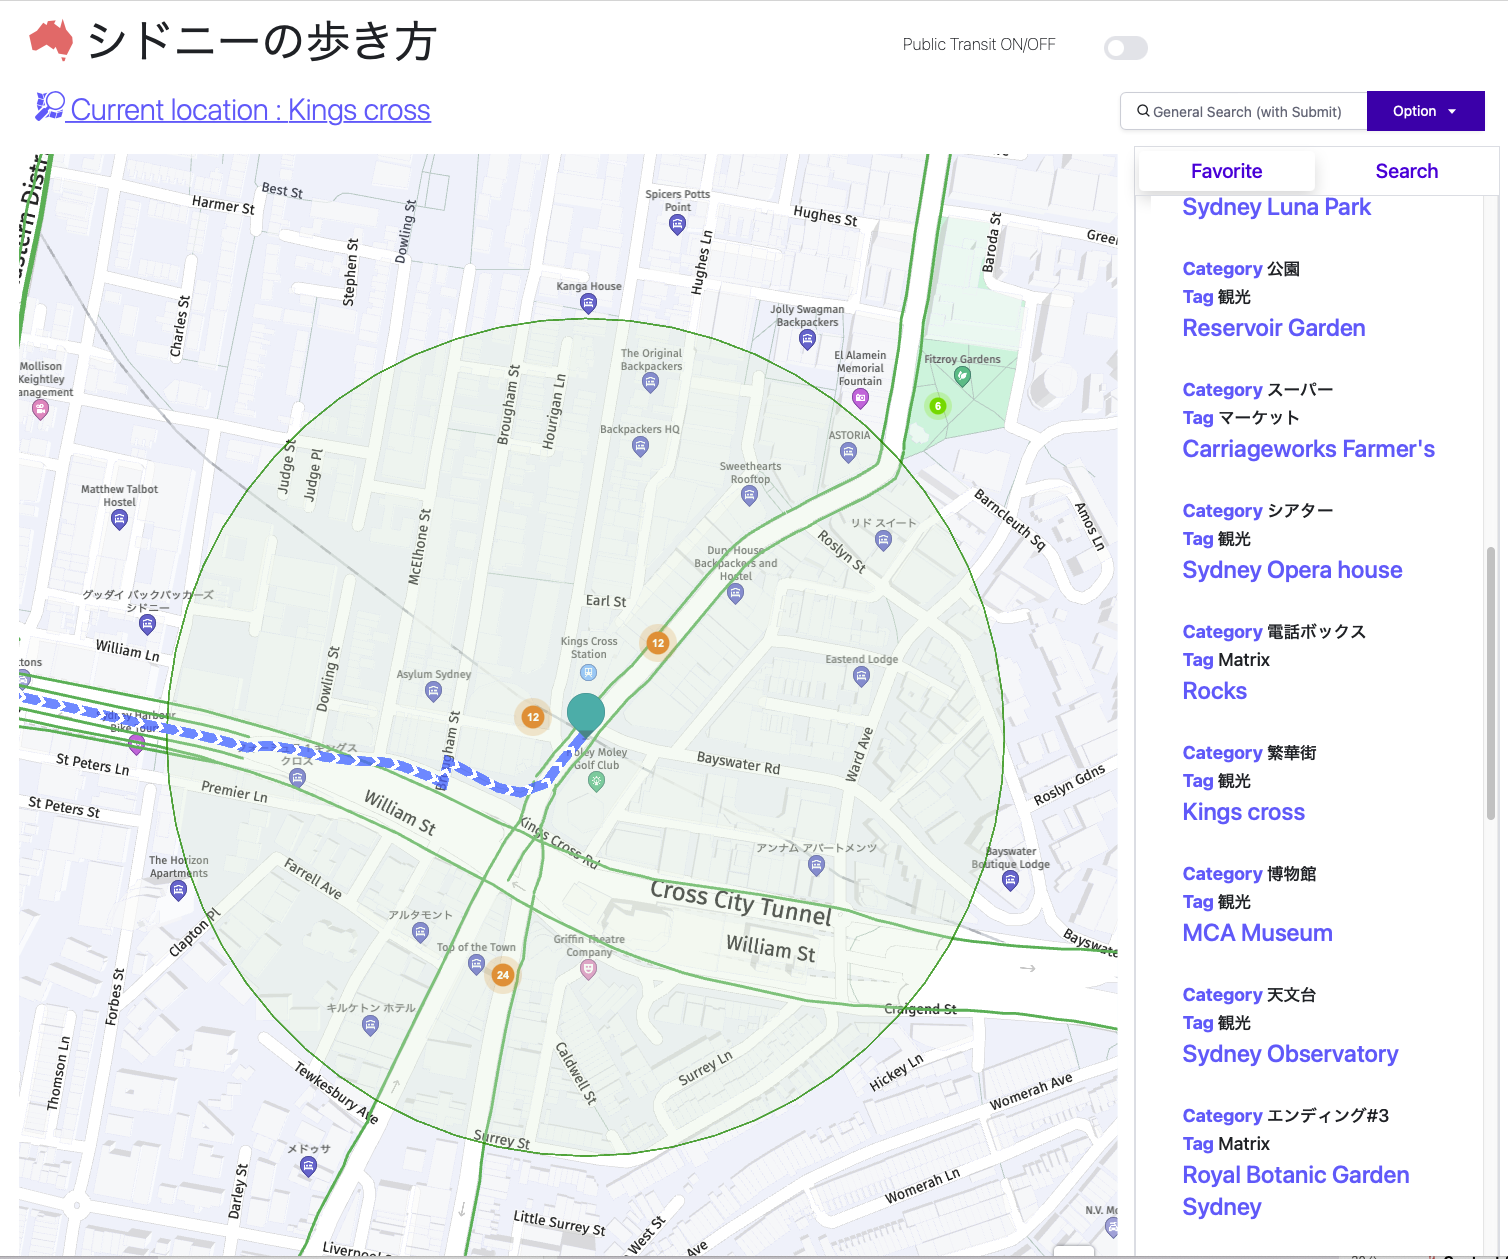
ここで言うクラスタリング分析機能とは、ホットスポット分析など、地図上でデータを定量的に分類することができる機能です。 前回ご紹介したサンプルアプリでは、Tweetが呟かれている場所とその数をクラスタリング分析して表現しております。そして、そのTweetデータ群をReactコンポーネントへ渡すことで、Tweetが更新される毎に分析結果を地図上に更新します。こうすることで、動的に現在その地点で何が呟かれ、どういった状況かを確認することができます。(下のイメージではオレンジ内の数字がそれにあたります。)
以下はHERE公式のクラスタリングサンプルの説明記事です。
そもそも地図を描くということは?
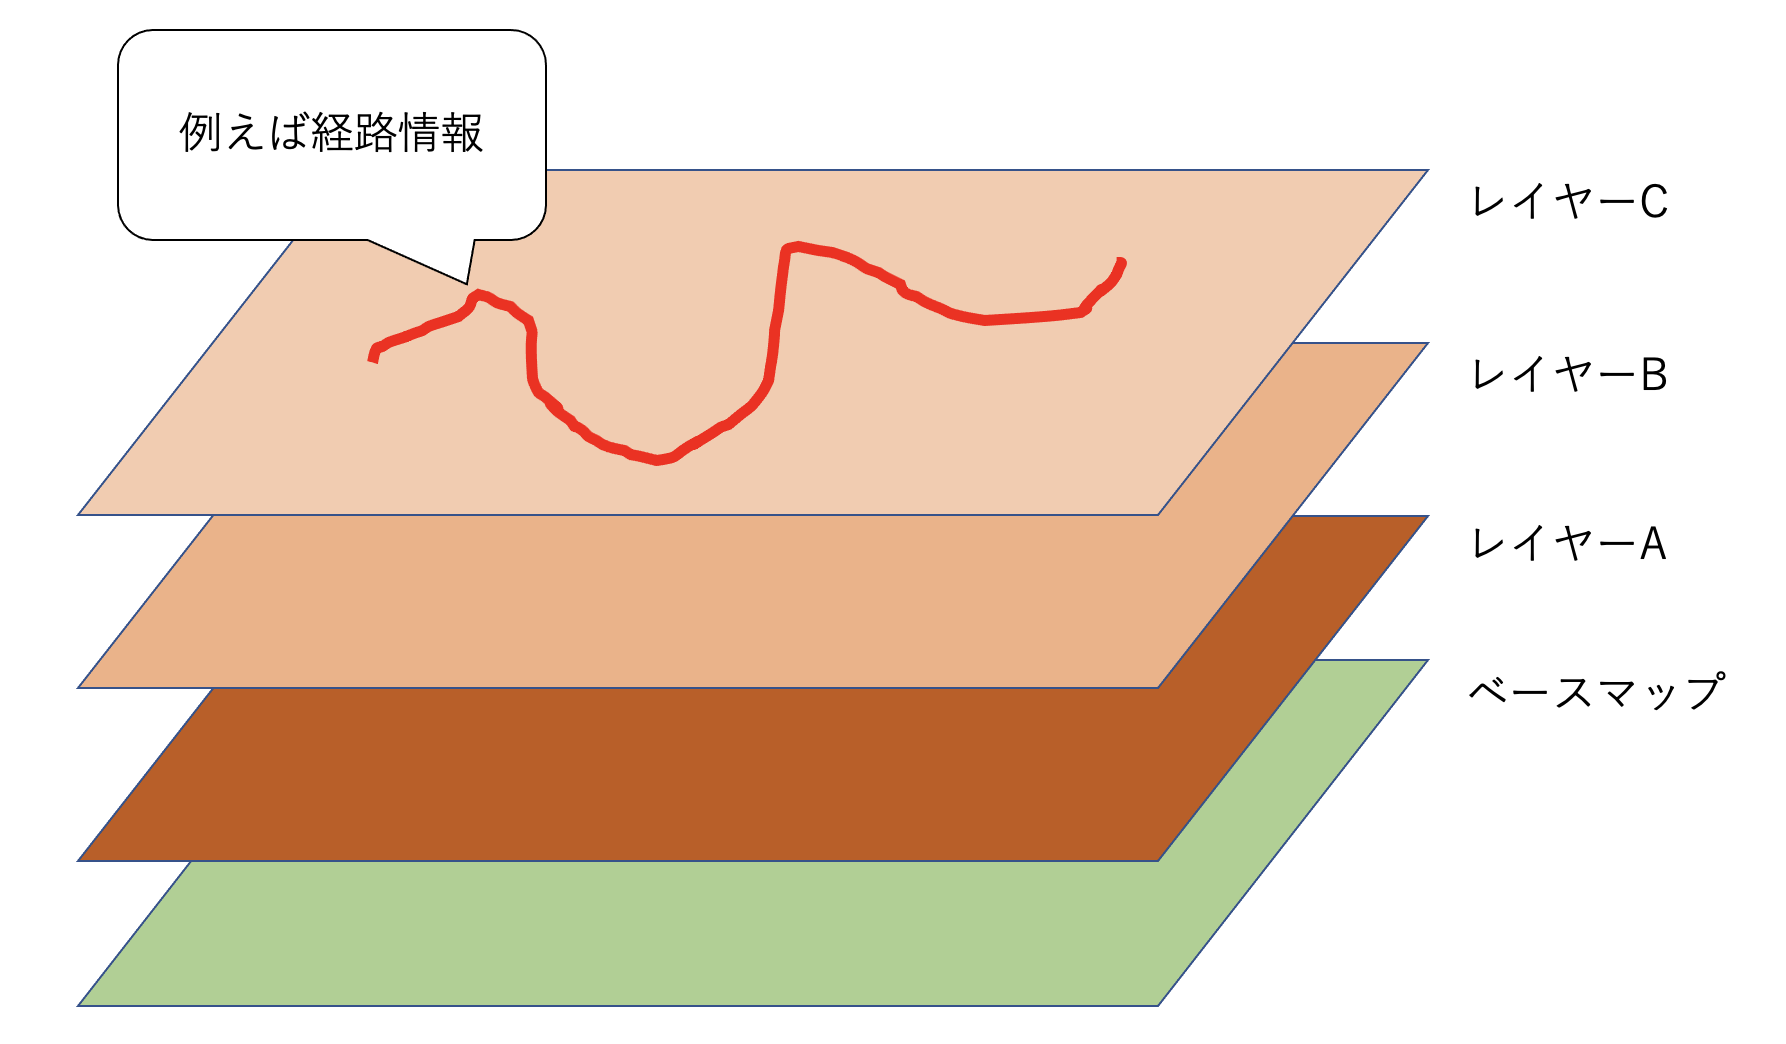
GISについて詳しい方には釈迦に説法となってしまいますが、地図を描くと言うことはAPIに限らずレイヤやオブジェクトを折り重ねて、必要な情報を作り上げていくことです。
実際、前回のサンプルコードにおいても以下のようなコードがありました。
    // Add the marker to the map:
    map.addObject(marker);
こちらのような要領でベースマップの上に折り重ねていきます。
(前回のサンプルではロケーションアイコン)
HERE MapのReactへの組み込み例 〜クラスタリング分析機能〜
それでは、前回のReactコンポーネントを発展する形で進めます。
以下のサンプルは、説明を単純化するために(上記アプリイメージにあります)Favoriteリストを使用してクラスタリング分析機能を実現します。(本来はFavoriteリストのような固定データではなくTweetのような動的なデータに向いていますが、Tweetの部分を説明するとややこしくなるのでこちらは割愛します。)
前回のDisplayMap.jsの以下のコードに、まずはPropsとしてFavoriteリストを与えてあげます。
export const DisplayMap = React.memo(({favoriteList, gps }) => {
そしてDefault UI componentを作成している以下のコードの下に
// Create the default UI components
    var ui = H.ui.UI.createDefault(map, defaultLayers);
以下のコードを追加することでFavoriteリストがクラスタリング分析されます。
    let sortData = [];
    favoriteList.map(function (item) {
        if(item.geometry.coordinates.length != 0) {
           sortData.push(item);
       }
    } );
    if (sortData.length != 0) {
      //First we need to create an array of DataPoint objects,
      //for the ClusterProvider
      var dataPoints = favoriteList.map(function (item) {
                return new H.clustering.DataPoint(item.geometry.coordinates[0][0][1], item.geometry.coordinates[0][0][0]);
      });

 //     Create a clustering provider with custom options for clusterizing the input
      var clusteredDataProvider = new H.clustering.Provider(dataPoints, {
          clusteringOptions: {
          // Maximum radius of the neighbourhood
          eps: 256,
          // minimum weight of points required to form a cluster
          minWeight: 1
          }
      });

      // Create a layer tha will consume objects from our clustering provider
      var clusteringLayer = new H.map.layer.ObjectLayer(clusteredDataProvider);

      // // To make objects from clustering provder visible,
      // // we need to add our layer to the map
      map.addLayer(clusteringLayer);
    }
上記のコードを簡単に解説しますと、favoriteListは、緯度、経度情報を含んだデータ構造のリストとなっておりますので、そのレングスが0でなければ、Datapointsオブジェクトを作成し、それぞれをクラスタリング分析の対象にします。(本来はコンポーネント内にこのようにデータ構造を書き込むのはよくないのですが、その部分はご容赦ください。)
そして、clustering providerを作成しレイヤ化します。
最後に、map.addLayer()でそのレイヤが折り重なります。
DisplayMap.js
以下、更新後のコードになります。
favoriteListをコンポーネントに渡しておりますので、こちらの変更に伴い新たな地図が描画されます。
import * as React from 'react';

export const DisplayMap = React.memo(({favoriteList, gps }) => {
  // Create a reference to the HTML element we want to put the map on
  const mapRef = React.useRef(null);
  /**
   * Create the map instance
   * While `useEffect` could also be used here, `useLayoutEffect` will render
   * the map sooner
   */
    // React.useEffect(() => {
   React.useLayoutEffect(() => {
    // `mapRef.current` will be `undefined` when this hook first runs; edge case that
    if (!mapRef.current) return;
    const H = window.H;
    const platform = new H.service.Platform({
        apikey: {API KEY} //こちらはAPIKEYなので、取得されましたものをそれぞれ入力ください。
    });
    const defaultLayers = platform.createDefaultLayers();
    // configure an OMV service to use the `core` endpoint
    var omvService = platform.getOMVService({ path: "v2/vectortiles/core/mc" });
    var baseUrl = "https://js.api.here.com/v3/3.1/styles/omv/oslo/japan/";

    // create a Japan specific style
    var style = new H.map.Style(`${baseUrl}normal.day.yaml`, baseUrl);

    // instantiate provider and layer for the base map
    var omvProvider = new H.service.omv.Provider(omvService, style);
    var omvlayer = new H.map.layer.TileLayer(omvProvider, { max: 22 ,dark:true});

    // instantiate (and display) a map:
    var map = new H.Map(mapRef.current, omvlayer, {
        zoom: 16,
        center: { lat: gps.latitude, lng: gps.longitude },
    });

    // add a resize listener to make sure that the map occupies the whole container
    window.addEventListener("resize", () => map.getViewPort().resize());

    // MapEvents enables the event system
    // Behavior implements default interactions for pan/zoom (also on mobile touch environments)
    var behavior = new H.mapevents.Behavior(new H.mapevents.MapEvents(map));
    // Create the default UI components
    var ui = H.ui.UI.createDefault(map, defaultLayers);
    let sortData = [];
    favoriteList.map(function (item) {
        if(item.geometry.coordinates.length != 0) {
           sortData.push(item);
       }
    } );
    if (sortData.length != 0) {
      //First we need to create an array of DataPoint objects,
      //for the ClusterProvider
      var dataPoints = favoriteList.map(function (item) {
                return new H.clustering.DataPoint(item.geometry.coordinates[0][0][1], item.geometry.coordinates[0][0][0]);
      });

 //     Create a clustering provider with custom options for clusterizing the input
      var clusteredDataProvider = new H.clustering.Provider(dataPoints, {
          clusteringOptions: {
          // Maximum radius of the neighbourhood
          eps: 256,
          // minimum weight of points required to form a cluster
          minWeight: 1
          }
      });

      // Create a layer tha will consume objects from our clustering provider
      var clusteringLayer = new H.map.layer.ObjectLayer(clusteredDataProvider);

      // // To make objects from clustering provder visible,
      // // we need to add our layer to the map
      map.addLayer(clusteringLayer);
    }
    // Marker code goes here
    var LocationOfMarker = { lat: gps.latitude, lng: gps.longitude };
    var pngIcon = new H.map.Icon('<svg xmlns="http://www.w3.org/2000/svg" width="24" height="24" viewBox="0 0 24 24"><path d="M12 2c2.131 0 4 1.73 4 3.702 0 2.05-1.714 4.941-4 8.561-2.286-3.62-4-6.511-4-8.561 0-1.972 1.869-3.702 4-3.702zm0-2c-3.148 0-6 2.553-6 5.702 0 3.148 2.602 6.907 6 12.298 3.398-5.391 6-9.15 6-12.298 0-3.149-2.851-5.702-6-5.702zm0 8c-1.105 0-2-.895-2-2s.895-2 2-2 2 .895 2 2-.895 2-2 2zm10.881-2.501c0-1.492-.739-2.83-1.902-3.748l.741-.752c1.395 1.101 2.28 2.706 2.28 4.5s-.885 3.4-2.28 4.501l-.741-.753c1.163-.917 1.902-2.256 1.902-3.748zm-3.381 2.249l.74.751c.931-.733 1.521-1.804 1.521-3 0-1.195-.59-2.267-1.521-3l-.74.751c.697.551 1.141 1.354 1.141 2.249s-.444 1.699-1.141 2.249zm-16.479 1.499l-.741.753c-1.395-1.101-2.28-2.707-2.28-4.501s.885-3.399 2.28-4.5l.741.752c-1.163.918-1.902 2.256-1.902 3.748s.739 2.831 1.902 3.748zm.338-3.748c0-.896.443-1.698 1.141-2.249l-.74-.751c-.931.733-1.521 1.805-1.521 3 0 1.196.59 2.267 1.521 3l.74-.751c-.697-.55-1.141-1.353-1.141-2.249zm16.641 14.501c0 2.209-3.581 4-8 4s-8-1.791-8-4c0-1.602 1.888-2.98 4.608-3.619l1.154 1.824c-.401.068-.806.135-1.178.242-3.312.949-3.453 2.109-.021 3.102 2.088.603 4.777.605 6.874-.001 3.619-1.047 3.164-2.275-.268-3.167-.296-.077-.621-.118-.936-.171l1.156-1.828c2.723.638 4.611 2.016 4.611 3.618z"/></svg>', { size: { w: 56, h: 56 } });

    // Create a marker using the previously instantiated icon:
    var marker = new H.map.Marker(LocationOfMarker, { icon: pngIcon });

    // Add the marker to the map:
    map.addObject(marker);

    // Optionally,
    //Show the marker in the center of the map
    map.setCenter(LocationOfMarker)

    //Zooming so that the marker can be clearly visible
    map.setZoom(16)
    // This will act as a cleanup to run once this hook runs again.
    // This includes when the component un-mounts
    return () => {
      map.dispose();
    };
  }, [favoriteList]); // This will run this hook every time this ref is updated
  return <div className="map h-screen" ref={mapRef}  />;
});
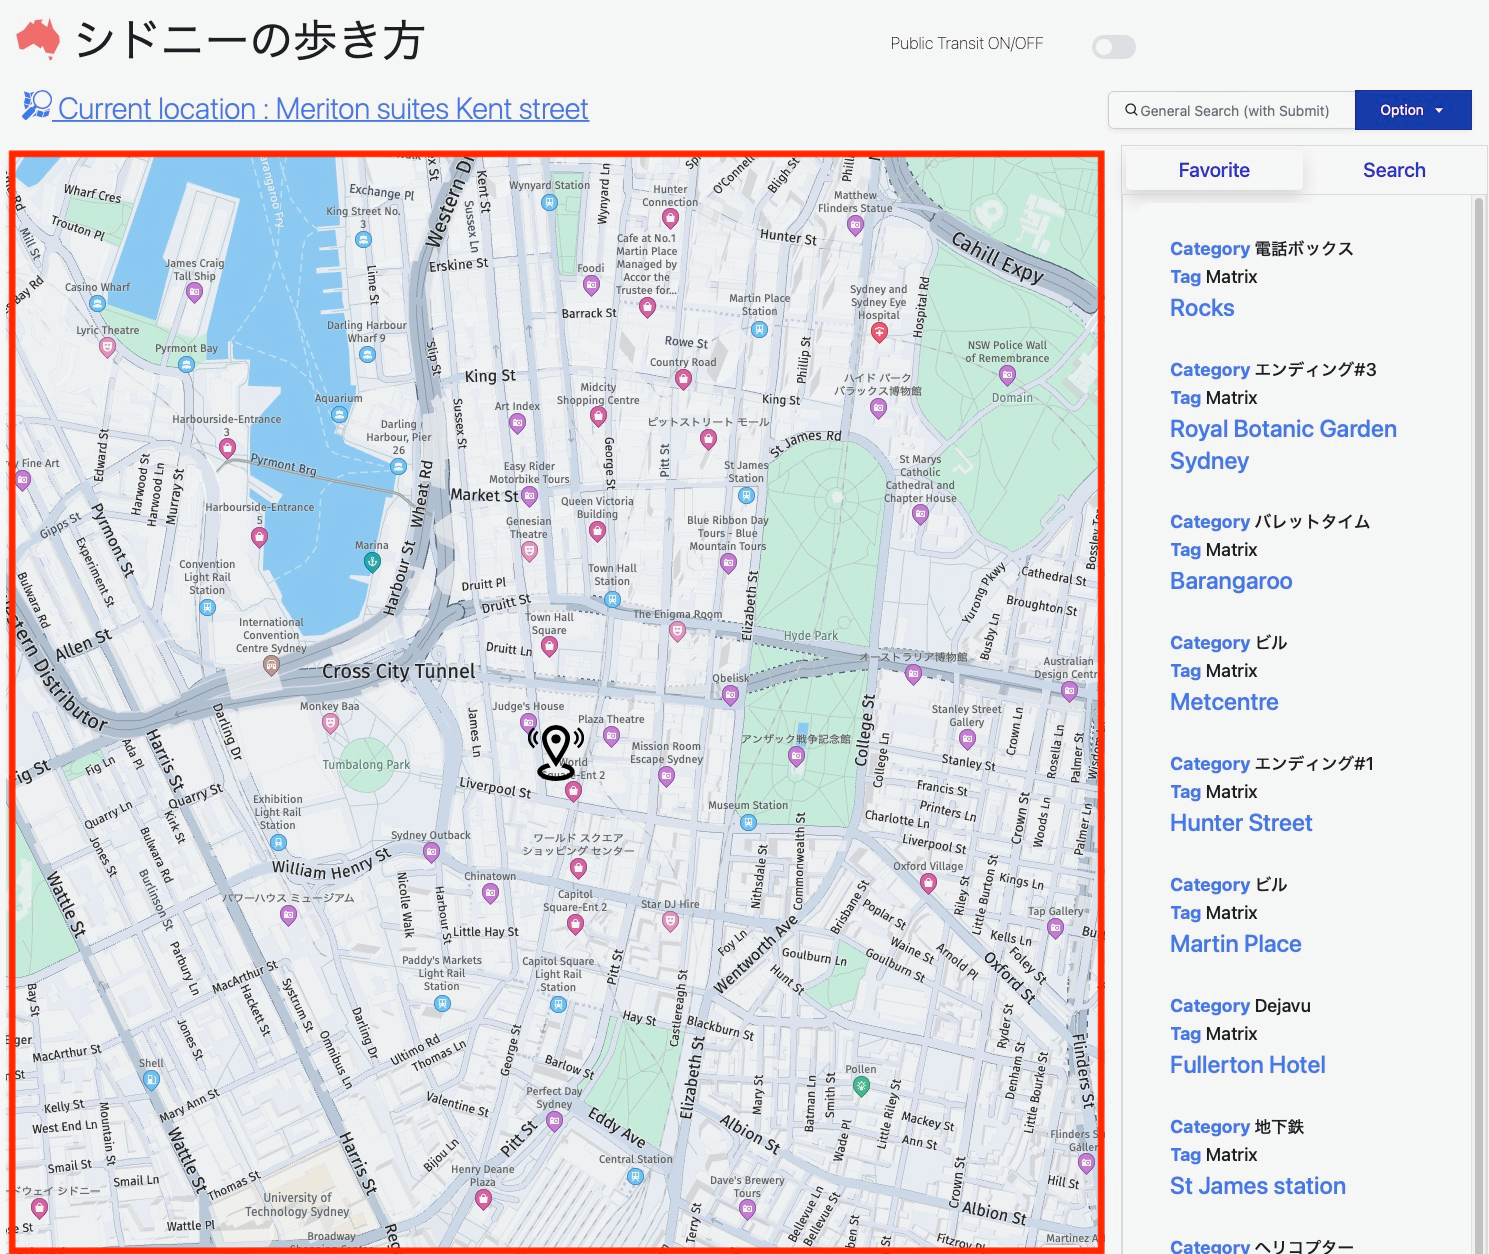
つまり、コンポーネントに渡すリスト次第でさまざまなデータに対してのクラスタリング分析が可能ということになります。
以下のGIFアニメでは、シドニーに中心街から広域地図(ブルーマウンテンズ)までズームアウトして、目的地の分布具合を可視化させています。
おわりに
いかがでしたでしょうか?
上記のような要領で、皆様がお持ちのデータに対してちょっとしたクラスタリングデータ分析が可能になります。
次回はいよいよロケーションサービス製品群の花形(?)Routing関連について説明致します。