Toggl API & Pyhon -> Monthly Timeline Report
起 : はじまり
業務効率の自己分析を行う為にTogglを使用しています。
ProjectはGetting Things Doneを元に適当に作成、それに紐付けるClientの分類はEisenhower Matrixの第一象限~第四象限で分類しています。
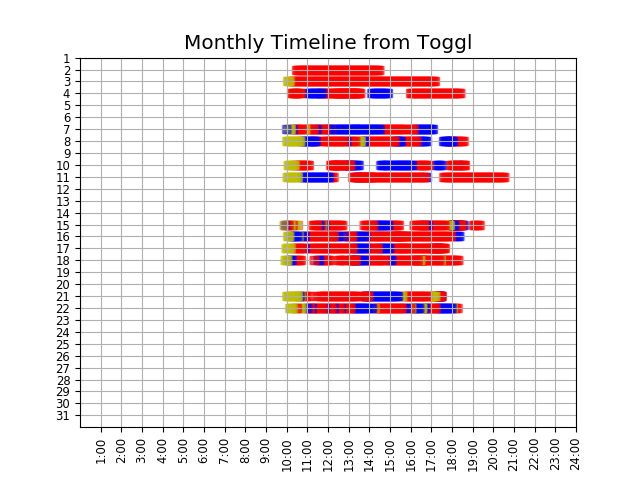
本家のレポートも良いのですが、日毎時間帯別の結果を一ヶ月の一覧表で見たくなりました。
そしてPythonも勉強し始めたばかり。
環境は以下の通りです。
- Windows 8.1
- Python 2.7
- Visual Studio Code
いざや、Toggl APIとPythonでレポート作成に挑戦。
承 : つかったもの
Googleにて検索して、主にこちらの記事とリファレンスを参考にさせて頂きました。
参考:
転 : つくったもの
参考先のコードを元に四苦八苦。
# -*- coding: utf-8 -*-
import requests
from requests.auth import HTTPBasicAuth
import json
import datetime
from datetime import datetime as dt
from dateutil.parser import parse
import matplotlib
import matplotlib.pyplot as plt
import pandas as pd
import numpy as np

# Dataframeの用意
pd.set_option('display.max_colwidth', 20)
df = pd.DataFrame([[0], [0], [0], [0], [0], [0]]).T
df.columns = ["description", "category", "client", "date", "month", "duration"]

_api_token = '{キー}' # ここにAPIキーを入れる

for pagenumber in range(1000):
    pn = np.str(pagenumber + 1)
    _params = {
        'user_agent': '{メールアドレス}',       # ここにTogglに登録しているメールアドレスを入れる
        'workspace_id': '{アイディー}',         # ここにworkspace idを入れる
        'since': '2016-11-01',                  # 最初の日付
        'until': '2016-11-30',                  # 最後の日付
        'page': pn}
    r = requests.get('https://toggl.com/reports/api/v2/details', auth=HTTPBasicAuth(_api_token, 'api_token'), params=_params)

# データ取得
    data = r.json()
    Data = data['data']

    if len(Data) == 0:
        break
    row = 0
    for i in Data:
        dataset = Data[row]
        data01 = dataset['description']
        data02 = dataset['project']
        data03 = dataset['client']

        start = dataset['start']
        sd = start[0:10]        # Start Date
        st = start[11:19]       # Start Time
        s = sd + ' ' + st

        tdatetime = dt.strptime(s, '%Y-%m-%d %H:%M:%S')
        date_s = dt.strptime(s, '%Y-%m-%d %H:%M:%S')

        end = dataset['end']
        ed = end[0:10]          # End Date
        et = end[11:19]         # End Time
        e = ed + ' ' + et

        date_e = dt.strptime(e, '%Y-%m-%d %H:%M:%S')

        dur = date_e - date_s   # Duration

        data04 = sd
        data05 = tdatetime.month
        data06 = dur

# 開始と終了の時間を数値化
        data_s_h = datetime.datetime.strptime(str(date_s.hour), '%H')
        data_s_m = datetime.datetime.strptime(str(date_s.minute), '%M')
        data_e_h = datetime.datetime.strptime(str(date_e.hour), '%H')
        data_e_m = datetime.datetime.strptime(str(date_e.minute), '%M')
# 分へ換算
        TimeVal_s = (data_s_h.hour * 60) + data_s_m.minute
        TimeVal_e = (data_e_h.hour * 60) + data_e_m.minute

        ClientV = dataset['client']
# 日付を数値化
        DayV = datetime.datetime.strptime(str(tdatetime.day), '%d')
        y = DayV.day

# Clientで色を分ける
        for i in range(TimeVal_s, TimeVal_e):
            if ClientV == 'Quadrant_4':     # 第四象限(Not Importand & Not Urgent)は青色
                ColorV = 'b'
            elif ClientV == 'Quadrant_3':   # 第三象限(Not Importand & Urgent)は緑色
                ColorV = 'g'
            elif ClientV == 'Quadrant_2':   # 第二象限(Importand & Not Urgent)は黄色
                ColorV = 'y'
            elif ClientV == 'Quadrant_1':   # 第一象限(Importand & Urgent)は赤色
                ColorV = 'r'
            else:
                Client = 'k'                # 設定なしは黒
# 描画
            plt.plot(i, y)
            plt.scatter(i, y, c=ColorV, alpha = 0.2, marker = "s")

        TMPtime1 = (str(tdatetime.hour) + ":" + str(tdatetime.minute) + ":" + str(tdatetime.second))
        TMPtime2 = datetime.datetime.strptime(TMPtime1, '%H:%M:%S')

        series_add = pd.Series([data01, data02, data03, data04, data05, data06], index=["description", "category", "client", "date", "month", "duration"], name=row + 1)
        df = df.append(series_add)
        row += 1
# ダミー行を削除
df = df.drop(0)

plt.grid(True)
# x軸は1日(0~60*24)で一時間ごとにラベル
plt.xlim([0,1440])
plt.xticks([60,120,180,240,300,360,420,480,540,600,660,720,780,840,900,960,1020,1080,1140,1200,1260,1320,1380,1440], ["1:00","2:00","3:00","4:00","5:00","6:00","7:00","8:00","9:00","10:00","11:00","12:00","13:00","14:00","15:00","16:00","17:00","18:00","19:00","20:00","21:00","22:00","23:00","24:00"],rotation =90,fontsize ="small")
# y軸は一ヶ月で一日ごとにラベル
plt.ylim([0,30])
plt.yticks([1,2,3,4,5,6,7,8,9,10,11,12,13,14,15,16,17,18,19,20,21,22,23,24,25,26,27,28,29,30,31], ["31","30","29","28","27","26","25","24","23","22","21","20","19","18","17","16","15","14","13","12","11","10","9","8","7","6","5","4","3","2","1"], fontsize="small")

plt.style.use('ggplot')
plt.title("Monthly Timeline from Toggl")
plt.show()

# サマリーを出力
monthly_sheet = df.pivot_table("duration", aggfunc="sum", fill_value=0, index="category", columns="date").T
monthly_sheet.to_csv("Summary.csv", sep=",")
print monthly_sheet
結 : できたもの
一応、イメージしていた結果が得られました。
色から見るに、余裕の無さが伺えます。
というか途中から記録をサボっています。
余 : これから
とりあえずやりかたかったことの下地は出来ました。
しかし、まだまだ中身も外見も汚い。
理解不足の付け焼き刃、無駄も非効率も多く、美しくありません。
実行時に時間も掛かり過ぎています。(恐らく分データを一点ずつ散布図で描画してしまっている為)
勉強します。
もっとCoolでSmartな方法をご存じの方は御教授頂けますと幸いです。
以上、宜しくお願い致します。
[END]
