Grafana Lokiとは

Grafana Labが開発しているOSSのログ集約プロダクト。
2019年11月にversion 1.0をリリースしたばかりですが、以前から注目度は高く、2019年12月現在 GitHub Starは8,000を超えています。
https://github.com/grafana/loki
定番のEFK(Elasticsearch, Fluentd, Kibana)との違いはこちらを参照してみてください。
https://github.com/grafana/loki/blob/master/docs/overview/comparisons.md
そんなLokiを利用することを検討しており、今回とりあえず動かしてみました。
アーキテクチャー
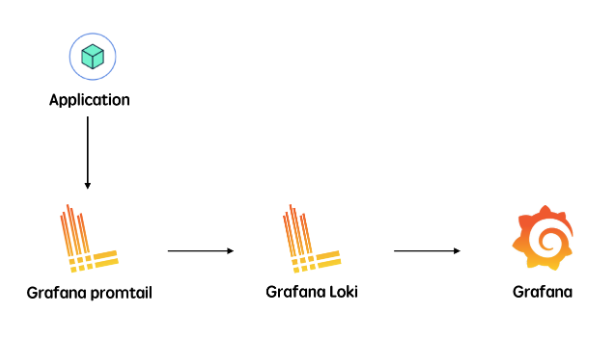
- promtailというAgentがApplicationの(デフォルトでは)標準出力からログを収集して、ラベルを付与してLokiに対してログを転送
- GrafanaはLokiからログを取り出して可視化
(https://note.com/_k_e_k_e/n/n9bcfa4ef9278 より引用)
環境
OS:Centos7
Dockerで動かすのでDockerとdocker-composeだけ準備して下さい。
ハンズオン
設定ファイルを作成し、コンテナを立ち上げる
まず、docker-compose.yamlを作成します。
version: "2"

networks:
  loki:

services:
  loki:
    image: grafana/loki:latest
    ports:
      - "3100:3100"
    command: -config.file=/etc/loki/local-config.yaml
    networks:
      - loki

  promtail:
    image: grafana/promtail:latest
    volumes:
      - /var/log:/var/log
      - /etc/promtail:/etc/promtail
    command: -config.file=/etc/promtail/handson-config.yaml
    networks:
      - loki

  grafana:
    image: grafana/grafana:master
    ports:
      - "3000:3000"
    networks:
      - loki
次に、サーバーからログをかき集めるpromtailの設定ファイルを作成します。
まず、どこでもいいですが、設定ファイルを格納する場所を決めます。(このパスはdocker-compose.yamlでマウントさせています。)
mkdir -p /etc/promtail
cd /etc/promtail
設定ファイルを作成します。
server:
  http_listen_port: 9080
  grpc_listen_port: 0

positions:
  filename: /tmp/positions.yaml

clients:
  - url: http://loki:3100/loki/api/v1/push

scrape_configs:
- job_name: systemlog
  static_configs:
  - targets:
      - localhost
    labels:
      job: syslogs
      __path__: /var/log/messages
scrape_configで収集するログを設定することができます。
今回はmessagesログを収集してみます。
このscrape_configを含めたconfig.yamlの詳細はこちらを参照してみてください。
あとはdocker-compose.yamlのある場所で、以下のコマンドを叩き、起動させます。
docker-compose up
Grafanaで見てみる
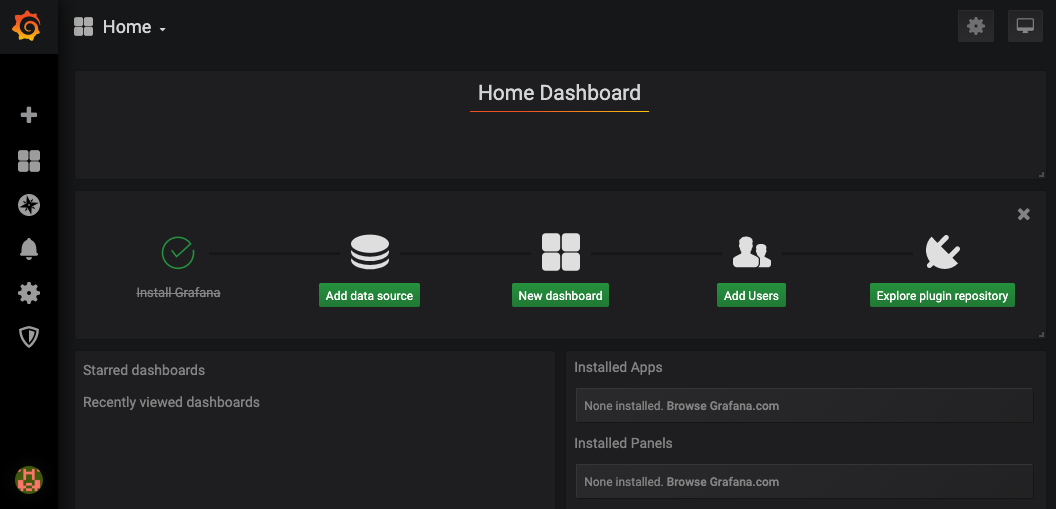
では、Grafanaでログを見るためにブラウザから
http://<your server>:3000 にアクセスしてみましょう。
usernameとpasswordはどちらもadminです。
-
中央のAdd data sourceをクリック。
-
Lokiを選択。
-
[HTTP] > [URL] >
http://loki:3100を記入。 > Save & Testをクリック。
- ↓のようにエラーが出ますが、無視して大丈夫です。
Data source connected, but no labels received. Verify that Loki and Promtail is configured properly.
Note: When running locally, Promtail starts before Loki is ready. This can lead to the error message "Data source connected, but no labels received." After a couple seconds, Promtail will forward all newly created log messages correctly. Until this is fixed we recommend building and running from source.
(https://github.com/grafana/loki/tree/master/production#run-locally-using-docker)
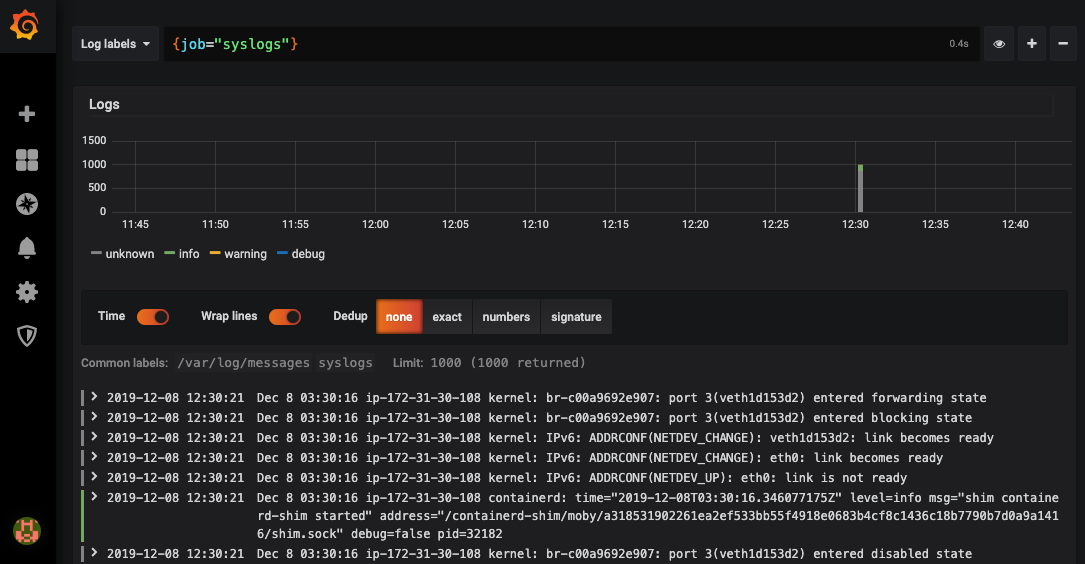
- 左ナビのExploreをクリック。
- Log labels > job > syslogs
messagesログが出てきました!
今後について
アラートについて、現在は
特定の文字列の時にpromtailでメトリクスを作れて、それをPrometheusでスクレイプし、Alertを出すことができるようです。
アラートの出し方や、configファイルの書き方などを投稿していければと思います。