はじめに
Microsoftが無償で提供しているデータサイエンス初心者向け講座の三日目はデータ可視化にチャレンジします。
対象読者
Python好き。
ロードマップ
Day3-1
Day3ゴール
birdsについてデータ可視化しながらmatplotlibに慣れる。
git(rawデータ)からbirds.csvを取得しDataFrameに格納する。
import pandas as pd

df = pd.read_csv("https://raw.githubusercontent.com/microsoft/Data-Science-For-Beginners/main/data/birds.csv")
df.head()
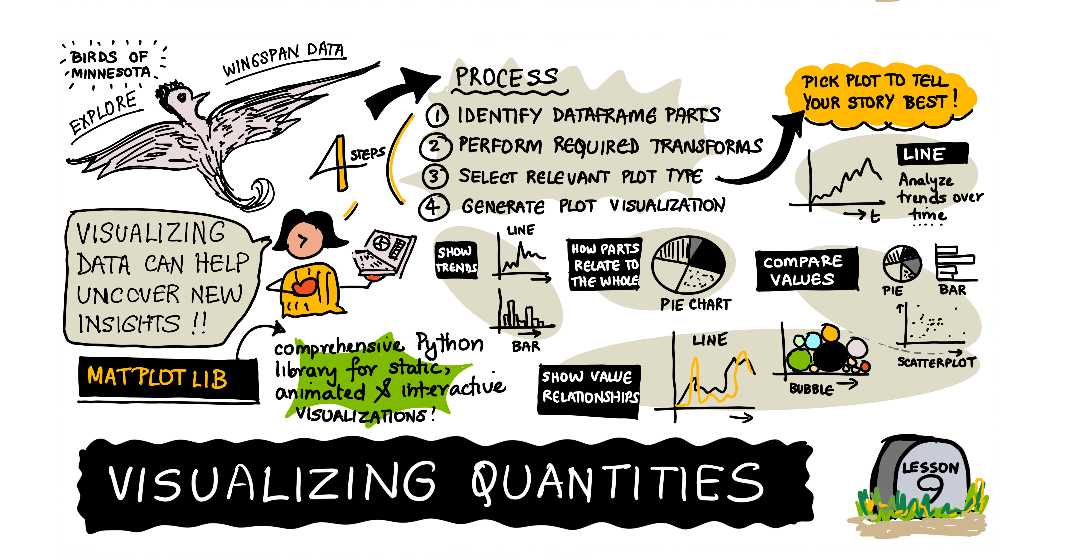
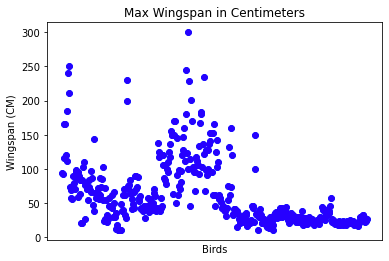
鳥たちの最大の翼幅をプロット
wingspan = df['MaxWingspan']
wingspan.plot()
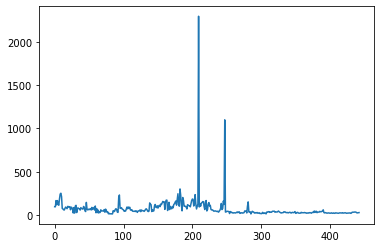
センチメートルに直す。
import matplotlib.pyplot as plt
plt.title('Max Wingspan in Centimeters')
plt.ylabel('Wingspan (CM)')
plt.xlabel('Birds')
plt.xticks(rotation=45)
x = df['Name']
y = df['MaxWingspan']

plt.plot(x, y)

plt.show()
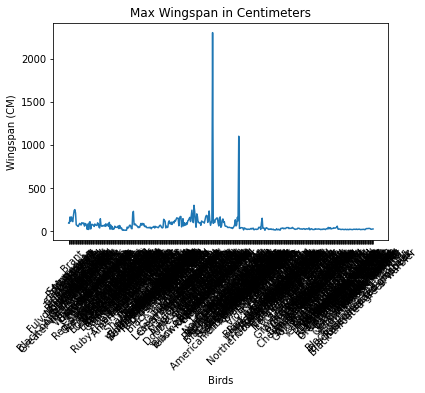
最大500cm(5m)を超える翼を持つ鳥を名前をつけてプロット
plt.title('Max Wingspan in Centimeters')
plt.ylabel('Wingspan (CM)')
plt.tick_params(axis='both',which='both',labelbottom=False,bottom=False)

for i in range(len(df)):
    x = df['Name'][i]
    y = df['MaxWingspan'][i]
    plt.plot(x, y, 'bo')
    if df['MaxWingspan'][i] > 500:
        plt.text(x, y * (1 - 0.05), df['Name'][i], fontsize=12)

plt.show()
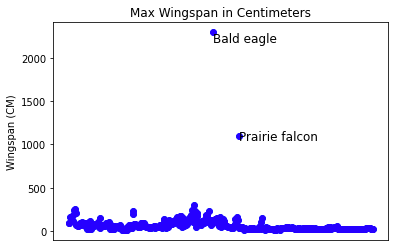
Bald Eagleとthe Prairie Falconを除外してプロット
plt.title('Max Wingspan in Centimeters')
plt.ylabel('Wingspan (CM)')
plt.xlabel('Birds')
plt.tick_params(axis='both',which='both',labelbottom=False,bottom=False)
for i in range(len(df)):
    x = df['Name'][i]
    y = df['MaxWingspan'][i]
    if df['Name'][i] not in ['Bald eagle', 'Prairie falcon']:
        plt.plot(x, y, 'bo')
plt.show()
積み上げ棒グラフ
df.plot(x='Category',
        kind='bar',
        stacked=True,
        title='Birds of Minnesota')
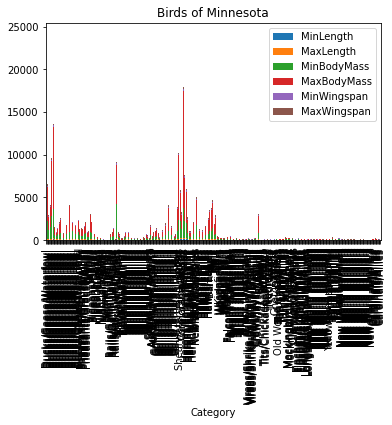
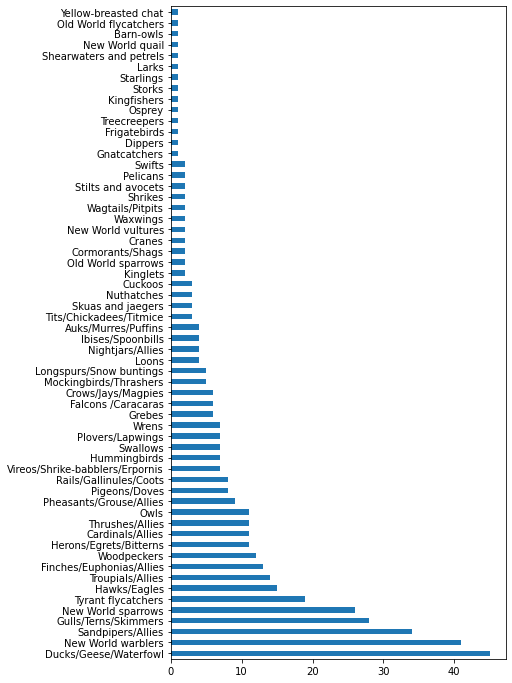
グループされていないデータが多く見にくいので、各グループの鳥数で集計して表示
category_count = df.value_counts(df['Category'].values, sort=True)
plt.rcParams['figure.figsize'] = [6, 12]
category_count.plot.barh()
最大の羽のサイズで比較
maxlength = df['MaxLength']
plt.barh(y=df['Category'], width=maxlength)
plt.rcParams['figure.figsize'] = [6, 12]
plt.show()
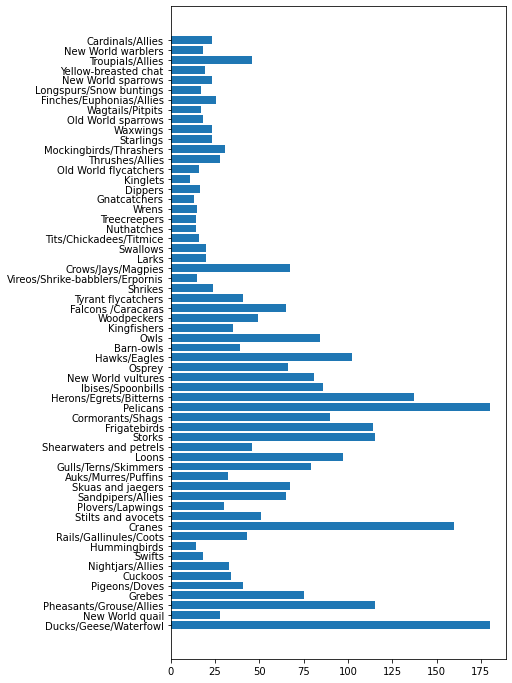
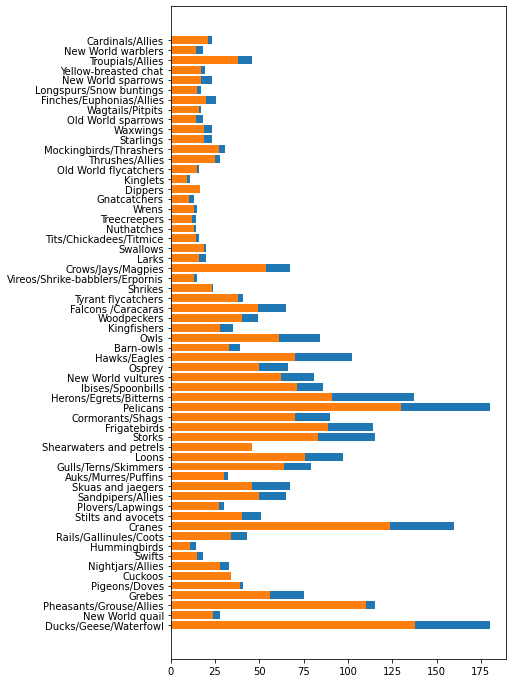
最小・最大翼幅を鳥のカテゴリ別にプロット
minLength = df['MinLength']
maxLength = df['MaxLength']
category = df['Category']

plt.barh(category, maxLength)
plt.barh(category, minLength)

plt.show()
matplotlibを使うと、簡単に可視化できるのでpandasとともにマスターできるとGOOD.
著者のTWITTERアカウント
ホームページ(pytorch/python/nlp)
参考文献