はじめに
本記事では、Microsoftのデータサイエンス初心者向けコースDay3の"Visualizing Distibutions"のPython関連をつまみ食いする。
対象読者
Pythonとデータサイエンスに興味があって、英語が苦手な人(英語が得意な人は、参考文献を直接解いてね。
データ用意&散布図を表示
鳥の順番ごとの体長の一般的な分布の概要を示すものですが、真の分布を表示するには最適な方法ではない。
import pandas as pd

birds = pd.read_csv("https://raw.githubusercontent.com/microsoft/Data-Science-For-Beginners/main/data/birds.csv")

import matplotlib.pyplot as plt


birds.plot(kind="scatter", x="MaxLength", y="Order", figsize=(12, 8))
plt.title("Max Length per Order")
plt.ylabel("Order")
plt.xlabel("Max Length")
plt.show()
ヒストグラム
Matplotlibで数値データの範囲全体に対するMaxBodyMassの分布を描画する。与えられたデータの配列をより小さなビンに分割することで、データの値の分布を表示することができます。
birds['MaxBodyMass'].plot(kind = 'hist', bins = 10, figsize = (12,12))
plt.show()
bin-sizeを変えて粒度を細かく見る。
birds['MaxBodyMass'].plot(kind = 'hist', bins = 30, figsize = (12,12))
plt.show()
体重でフィルタ
filteredBirds = birds[(birds['MaxBodyMass'] > 1) & (birds['MaxBodyMass'] < 60)]
filteredBirds['MaxBodyMass'].plot(kind = 'hist',bins = 40,figsize = (12,12))
plt.show()
2D-histogram
2つの分布の関係を比較するために2Dヒストグラムを作成する。MaxBodyMassとMaxLengthを比較してみよう。
x = filteredBirds['MaxBodyMass']
y = filteredBirds['MaxLength']

fig, ax = plt.subplots(tight_layout=True)
hist = ax.hist2d(x, y)
鳥の保護状態と最小翼幅の関係をヒストグラムで
x1 = filteredBirds.loc[filteredBirds.ConservationStatus=='EX', 'MinWingspan']
x2 = filteredBirds.loc[filteredBirds.ConservationStatus=='CR', 'MinWingspan']
x3 = filteredBirds.loc[filteredBirds.ConservationStatus=='EN', 'MinWingspan']
x4 = filteredBirds.loc[filteredBirds.ConservationStatus=='NT', 'MinWingspan']
x5 = filteredBirds.loc[filteredBirds.ConservationStatus=='VU', 'MinWingspan']
x6 = filteredBirds.loc[filteredBirds.ConservationStatus=='LC', 'MinWingspan']

kwargs = dict(alpha=0.5, bins=20)

plt.hist(x1, **kwargs, color='red', label='Extinct')
plt.hist(x2, **kwargs, color='orange', label='Critically Endangered')
plt.hist(x3, **kwargs, color='yellow', label='Endangered')
plt.hist(x4, **kwargs, color='green', label='Near Threatened')
plt.hist(x5, **kwargs, color='blue', label='Vulnerable')
plt.hist(x6, **kwargs, color='gray', label='Least Concern')

plt.gca().set(title='Conservation Status', ylabel='Min Wingspan')
plt.legend();
あまり相関関係は見られない。
最大体重のヒストグラム(保護状態別)
他に相関の見られそうなものがないかを軽く探って見たが、
最大体重が少し関係ありそうな程度で決定的なものはなかった。
attributes = "MaxBodyMass"
x1 = filteredBirds.loc[filteredBirds.ConservationStatus=='EX', attributes]
x2 = filteredBirds.loc[filteredBirds.ConservationStatus=='CR', attributes]
x3 = filteredBirds.loc[filteredBirds.ConservationStatus=='EN', attributes]
x4 = filteredBirds.loc[filteredBirds.ConservationStatus=='NT', attributes]
x5 = filteredBirds.loc[filteredBirds.ConservationStatus=='VU', attributes]
x6 = filteredBirds.loc[filteredBirds.ConservationStatus=='LC', attributes]

kwargs = dict(alpha=0.5, bins=20)

plt.hist(x1, **kwargs, color='red', label='Extinct')
plt.hist(x2, **kwargs, color='orange', label='Critically Endangered')
plt.hist(x3, **kwargs, color='yellow', label='Endangered')
plt.hist(x4, **kwargs, color='green', label='Near Threatened')
plt.hist(x5, **kwargs, color='blue', label='Vulnerable')
plt.hist(x6, **kwargs, color='gray', label='Least Concern')

plt.gca().set(title='Conservation Status', ylabel=attributes)
plt.legend();
seaborn使って密度プロット
import seaborn as sns
import matplotlib.pyplot as plt
sns.kdeplot(filteredBirds['MinWingspan'])
plt.show()
鳥別の最大体格密度をseabornで表示
sns.kdeplot(
   data=filteredBirds, x="MaxBodyMass", hue="Order",
   fill=True, common_norm=False, palette="crest",
   alpha=.5, linewidth=0,
)
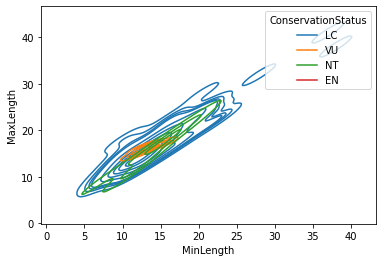
seabornで鳥のMaxLengthとMinLengthを保護状態と比較して可視化。
また、複数の変数の密度を1つのグラフにマッピングすることも可能。鳥のMaxLengthとMinLengthを保護状態と比較して可視化します。
sns.kdeplot(data=filteredBirds, x="MinLength", y="MaxLength", hue="ConservationStatus")
おしゃれなseabornグラフの出来上がり。デザイナの人が作ったのかな。すごく綺麗なグラフが数行で描けて便利なライブラリでした。
著者のTWITTERアカウント
ホームページ(pytorch/python/nlp)
参考文献


