はじめに
GAFAM(Google, Amazon, Facebook, Apple, Microsoft)のMは何と言ってもMicrosoft。
ビルゲイツ氏の時代はOSのイメージが強かったが、サティアナデラ氏がCEOの現在は、クラウドでイケイケの会社となっており、超ハイスキルの人財を多数抱え、世界最先端で人工知能・データサイエンス・機械学習を学べるコースを無償で提供している。そこで、Microsoftの寛大さに感謝しつつ、Pythonを使いながら、データサイエンスを勉強してみる。
対象読者
Pythonとデータサイエンスに興味があって、英語が苦手な人(英語が得意な人は、参考文献を直接解いてください。
ロードマップ
Day1
この記事では、Day1のチャレンジを翻訳しながらやってみる。
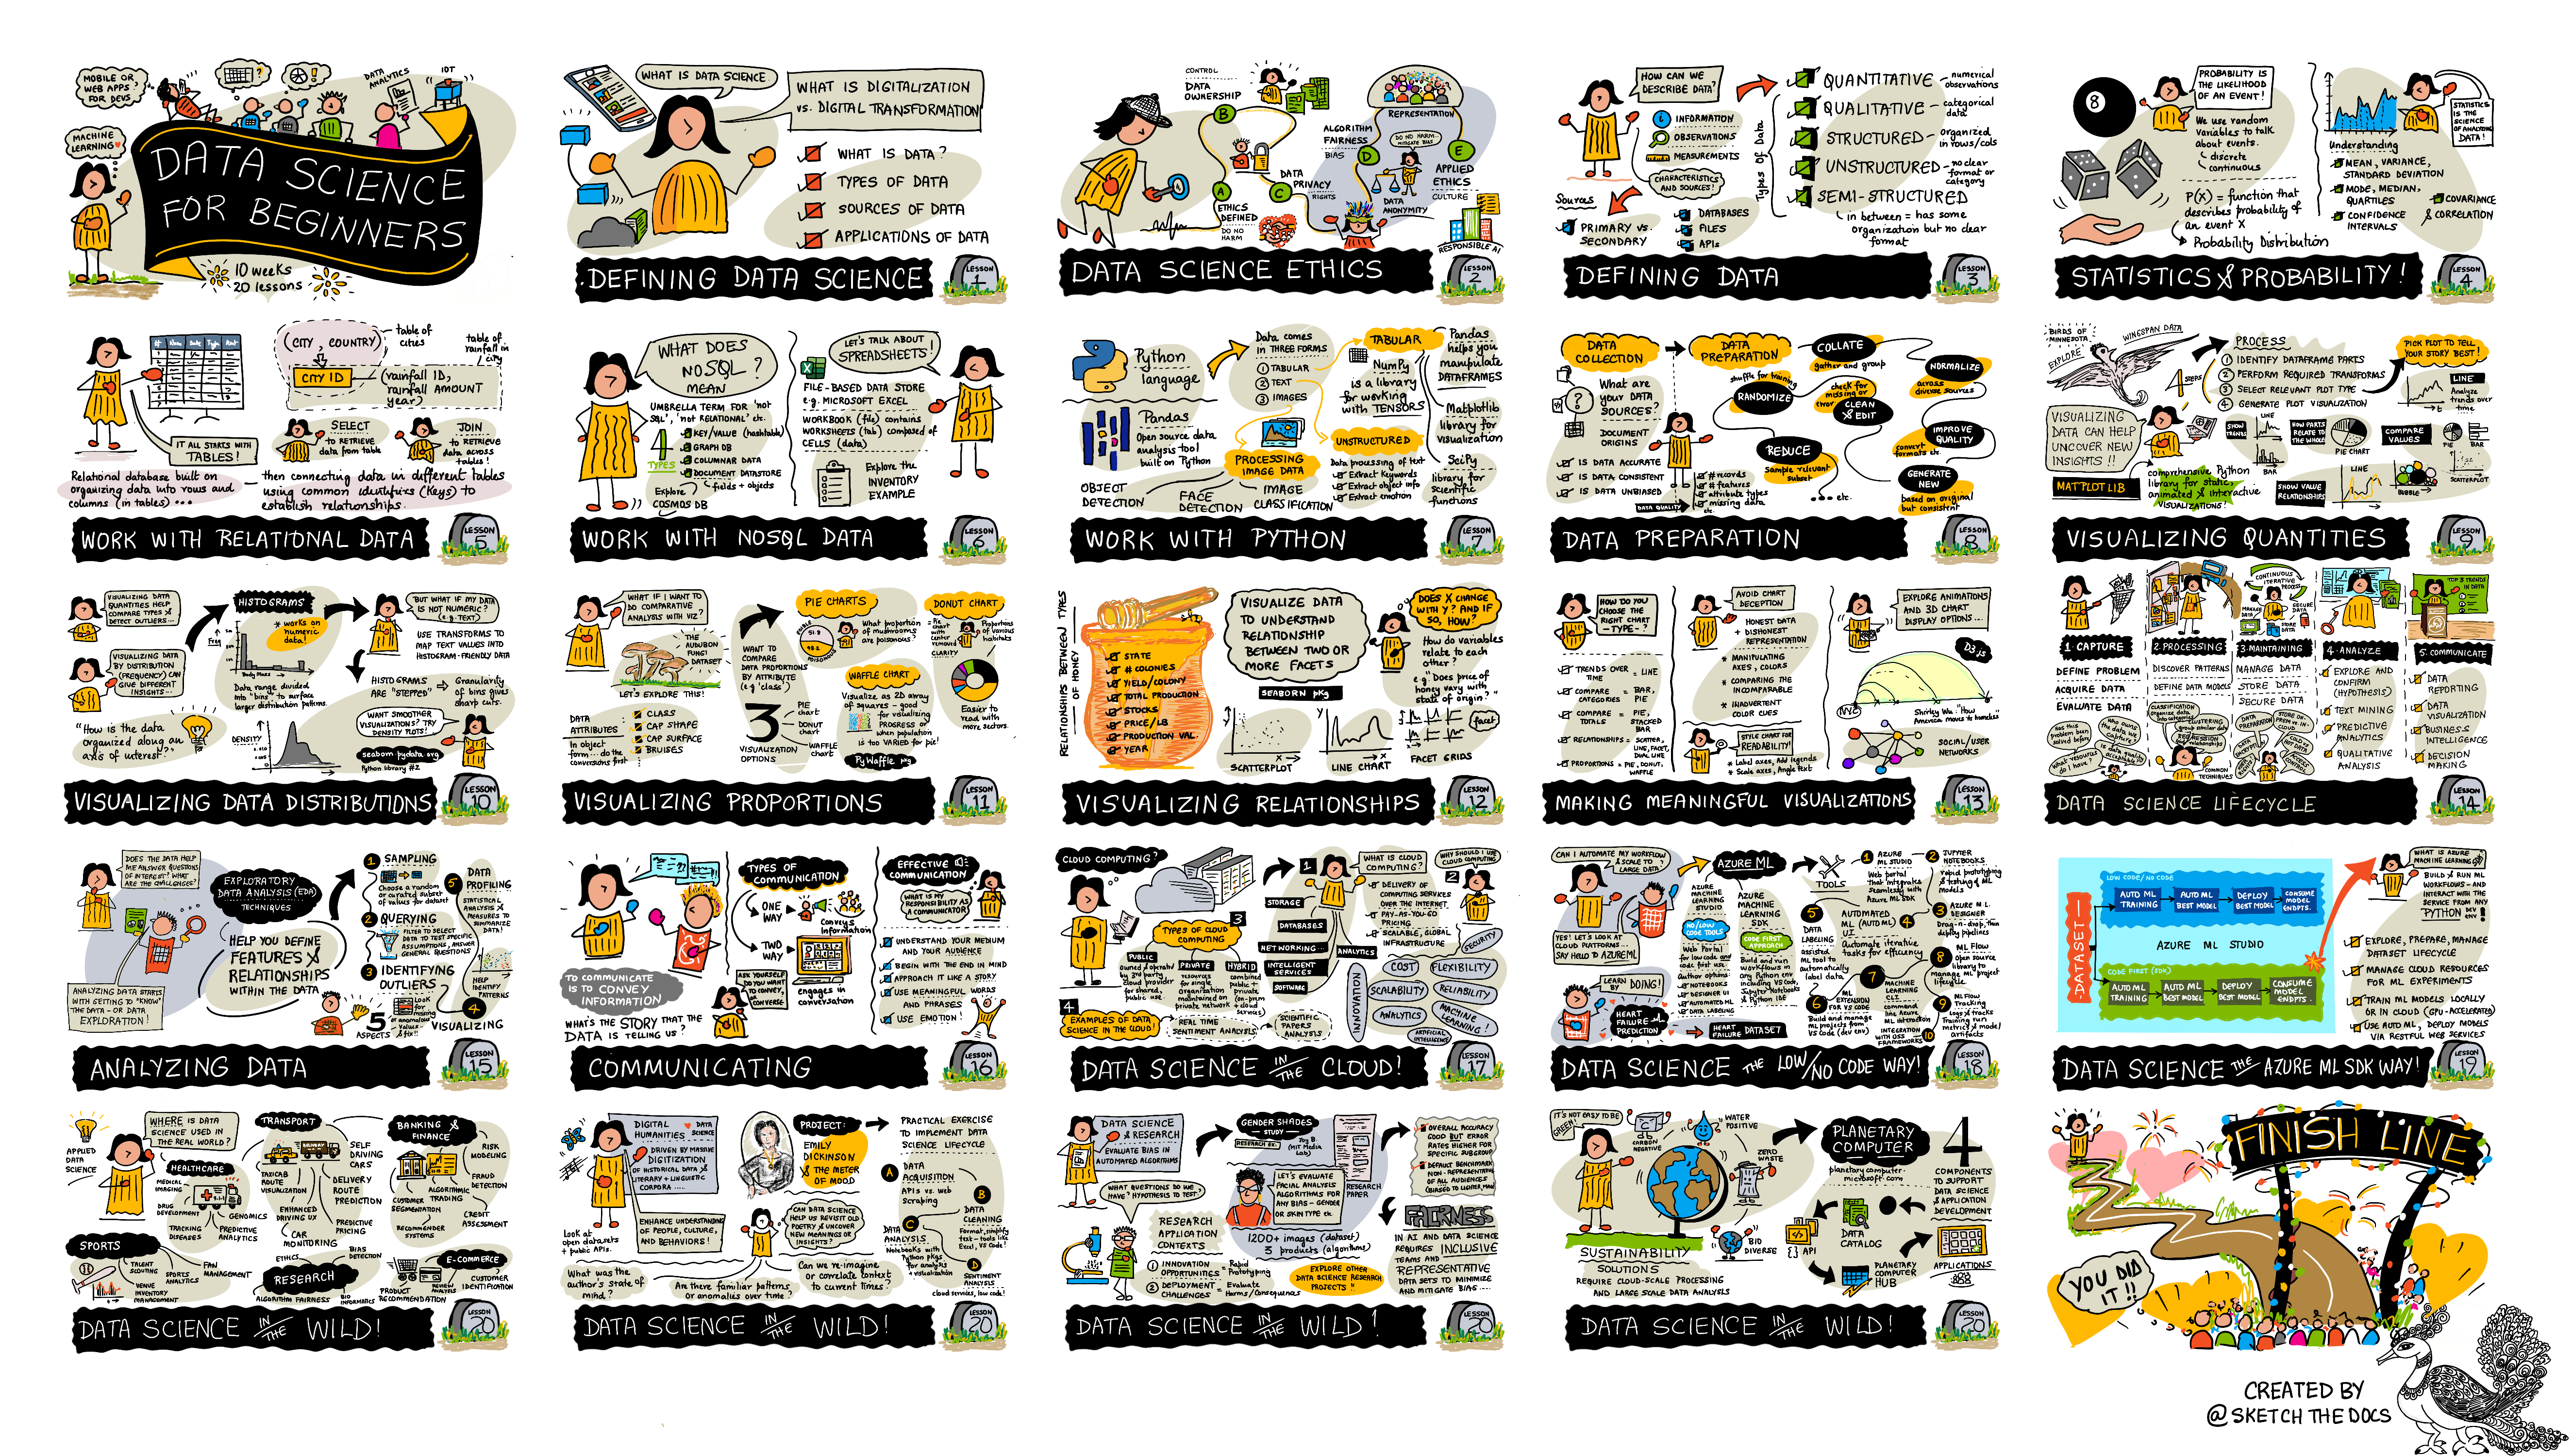
Day1ゴール
データサイエンスに関するWikipediaの記事からキーワード集計や可視化を行い、
気づき・洞察を得る。
Wikipediaからデータサイエンス記事を取得する。
import requests

url = 'https://en.wikipedia.org/wiki/Data_science'
ds_text = requests.get(url).content.decode('utf-8')
print(ds_text[:2000])
データ変換(HTMLから平文のテキストへ)
HTMLParserクラスでHTMLタグ内のテキストが取得できるが、子クラスのMyHTMLParserではscriptタグと、styleタグは読み飛ばす処理を入れている。
from html.parser import HTMLParser

class MyHTMLParser(HTMLParser):
    script = False
    res = ""
    def handle_starttag(self, tag, attrs):
        if tag.lower() in ["script","style"]:
            self.script = True
    def handle_endtag(self, tag):
        if tag.lower() in ["script","style"]:
            self.script = False
    def handle_data(self, data):
        if str.strip(data)=="" or self.script:
            return
        self.res += ' '+data.replace('[ edit ]','')

parser = MyHTMLParser()
parser.feed(ds_text)
ds_text = parser.res
print(ds_text[:2000])
高速頻度集計にnlp-rakeモジュールを使う。
import sys
!{sys.executable} -m pip install nlp_rake
頻度集計
5文字以上で、3回以上出現した2つの複合語までの単語を取得。
import nlp_rake
extractor = nlp_rake.Rake(max_words=2,min_freq=3,min_chars=5)
res = extractor.apply(ds_text)
print(res[:5])
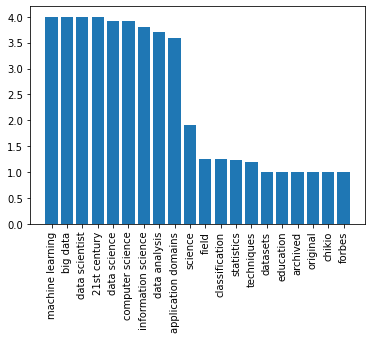
[('machine learning', 4.0), ('big data', 4.0), ('data scientist', 4.0), ('21st century', 4.0), ('data science', 3.9107142857142856)]
matplotlibで可視化
import matplotlib.pyplot as plt

def plot(pair_list):
    k,v = zip(*pair_list)
    plt.bar(range(len(k)),v)
    plt.xticks(range(len(k)),k,rotation='vertical')
    plt.show()

plot(res)
WordCloud(ワードクラウド)で可視化
!{sys.executable} -m pip install wordcloud
from wordcloud import WordCloud
import matplotlib.pyplot as plt

wc = WordCloud(background_color='white',width=800,height=600)
plt.figure(figsize=(15,7))
plt.imshow(wc.generate_from_frequencies({ k:v for k,v in res }))
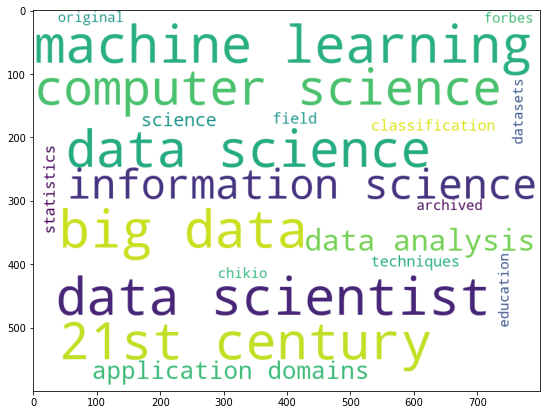
おしゃれなワードクラウドの出来上がり。さあ召し上がれ。
著者のTWITTERアカウント
ホームページ(pytorch/python/nlp)
参考文献