はじめに
GAFAM(Google, Amazon, Facebook, Apple, Microsoft)のMは何と言ってもMicrosoft。
ビルゲイツ氏の時代はOSのイメージが強かったが、サティアナデラ氏がCEOの現在は、クラウドでイケイケの会社となっており、超ハイスキルの人財を多数抱え、世界最先端で人工知能・データサイエンス・機械学習を学べるコースを無償で提供している。そこで、Microsoftの寛大さに感謝しつつ、Pythonを使いながら、データサイエンスを勉強してみる。
対象読者
Pythonとデータサイエンスに興味があって、英語が苦手な人(英語が得意な人は、参考文献を直接解いてください。
ロードマップ
Day2
この記事では、Day2のWork With Data, Work With Python, pandasチャレンジを翻訳しながらやってみる。SQLやNoSQL(Key-Value型のDBなど)は、簡単なデータ処理には便利だが、チューリング完全ではないため、一定以上複雑な処理には向かない。pandasでは、pythonコードを書くことでどんなデータ処理にも対応できるので、データ分析には最適である。
Day2ゴール
pythonのpandasライブラリで以下のデータ処理をする。
まず本記事では1.を扱う。
- COVID-19国別感染者の集計(構造化されたデータ)
- COVID-19論文の解析(非構造データ)
利用するライブラリの概要
- pandas
pandasライブラリでは、リレーショナルテーブルに類似した、いわゆるDataframeを操作することができます。名前付きカラムを持つことができ、行、カラム、データフレームに対して一般的に異なる操作を行うことができます。
- numpy
numpyライブラリは、テンソル、すなわち多次元配列を扱うためのライブラリである。配列は同じ型の値を持ち、dataframeより単純ですが、より多くの数学的操作を提供し、オーバーヘッドを少なくします。
- matplotlib
matplotlibはデータ可視化・グラフ描画に利用するライブラリです。少ないコードで綺麗なグラフが描けます。
- scipy
scipyライブラリは、いくつかの科学的な関数を追加扱うライブラリです。確率や統計の計算を効率的に行えます。
COVID-19 データロード
ジョンズ・ホプキンス大学システム科学工学センター(CSSE)から提供された、COVID-19感染者のデータを使用する。データセットはこのGitHub Repositoryで公開されている。
import numpy as np
import pandas as pd
import matplotlib.pyplot as plt
plt.rcParams["figure.figsize"] = (10,3) # グラフを大きめに描画
base_url = "https://raw.githubusercontent.com/CSSEGISandData/COVID-19/master/csse_covid_19_data/csse_covid_19_time_series/" # loading from Internet
# base_url = "../../data/COVID/" # loading from disk
infected_dataset_url = base_url + "time_series_covid19_confirmed_global.csv"
recovered_dataset_url = base_url + "time_series_covid19_recovered_global.csv"
deaths_dataset_url = base_url + "time_series_covid19_deaths_global.csv"
countries_dataset_url = base_url + "../UID_ISO_FIPS_LookUp_Table.csv"
infected = pd.read_csv(infected_dataset_url)
recovered = pd.read_csv(recovered_dataset_url)
deaths = pd.read_csv(deaths_dataset_url)
print(infected.columns)
print(infected.sample(5))
print(recovered.sample(5))
print(deaths.sample(5))
COVID-19
中国のCOVID-19感染者が報告された省庁のみを10件取り出してみる。
print(infected[infected['Country/Region']=='China']['Province/State'].head(10))
59 Anhui
60 Beijing
61 Chongqing
62 Fujian
63 Gansu
64 Guangdong
65 Guangxi
66 Guizhou
67 Hainan
68 Hebei
Name: Province/State, dtype: object
国別に集計してみる
infected = infected.groupby('Country/Region').sum()
recovered = recovered.groupby('Country/Region').sum()
deaths = deaths.groupby('Country/Region').sum()
日付順に感染者数・回復者数・死者数をDataFrameに格納
緯度・経度をdropしておかないと、pd.to_datetimeが効かないので注意。
def mkframe(country):
    df = pd.DataFrame({ 'infected' : infected.loc[country] ,
                        'recovered' : recovered.loc[country],
                        'deaths' : deaths.loc[country]})
    df.index = pd.to_datetime(df.index)
    return df

if 'Lat' in infected or 'Long' in infected:
  infected.drop(columns=['Lat','Long'],inplace=True)
  recovered.drop(columns=['Lat','Long'],inplace=True)
  deaths.drop(columns=['Lat','Long'],inplace=True)

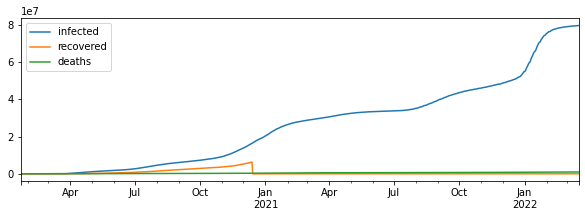
df = mkframe('US')
df.plot()
plt.show()
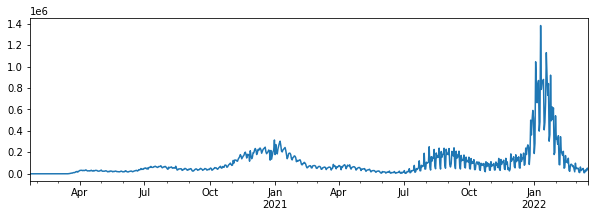
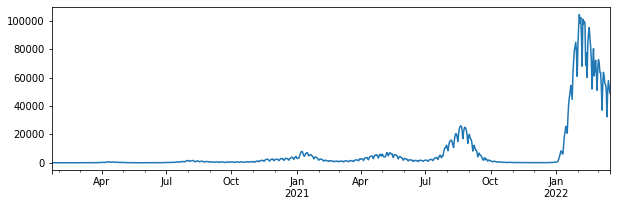
毎日どれだけ新規感染者が増えたかを計算する
df['ninfected'] = df['infected'].diff()
df['ninfected'].plot()
plt.show()
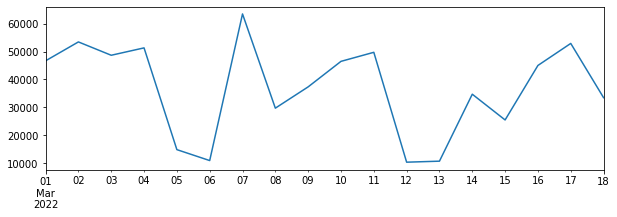
特定の期間を重点的(例えば2022/3月)に見てみる。
df[(df.index.year==2022) & (df.index.month==3)]['ninfected'].plot()
plt.show()
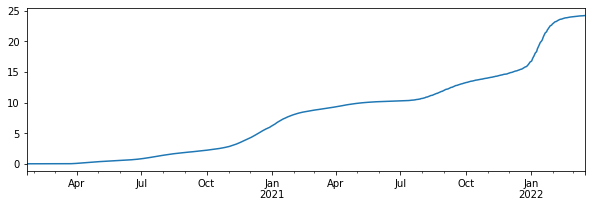
国別比較で各国の人口の違いを加味するためにデータを格納
countries = pd.read_csv(countries_dataset_url)
pop = countries[(countries['Country_Region']=='US') & countries['Province_State'].isna()]['Population'].iloc[0]
df['pinfected'] = df['infected']*100 / pop
df['pinfected'].plot(figsize=(10,3))
plt.show()
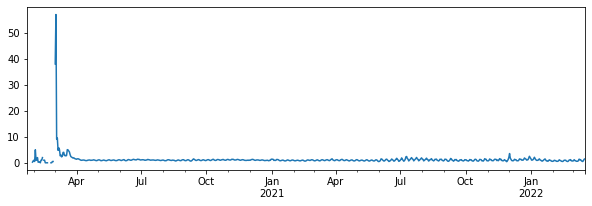
実行再生産数の推移を計算する。
df['Rt'] = df['ninfected'].rolling(8).apply(lambda x: x[4:].sum()/x[:4].sum())
df['Rt'].plot()
plt.show()
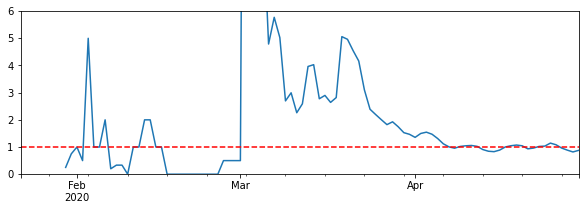
パンデミックの始まり頃の実行再生数の推移を確認する
ax = df[df.index<"2020-05-01"]['Rt'].replace(np.inf,np.nan).fillna(method='pad').plot(figsize=(10,3))
ax.set_ylim([0,6])
ax.axhline(1,linestyle='--',color='red')
plt.show()
我が国の新規感染者数の推移を見る。
オミクロン株の収束の兆しも見えなくもない。
import numpy as np
import pandas as pd
import matplotlib.pyplot as plt
plt.rcParams["figure.figsize"] = (10,3) # グラフを大きめに描画
base_url = "https://raw.githubusercontent.com/CSSEGISandData/COVID-19/master/csse_covid_19_data/csse_covid_19_time_series/" # loading from Internet
# base_url = "../../data/COVID/" # loading from disk
infected_dataset_url = base_url + "time_series_covid19_confirmed_global.csv"
recovered_dataset_url = base_url + "time_series_covid19_recovered_global.csv"
deaths_dataset_url = base_url + "time_series_covid19_deaths_global.csv"
countries_dataset_url = base_url + "../UID_ISO_FIPS_LookUp_Table.csv"
infected = pd.read_csv(infected_dataset_url)
recovered = pd.read_csv(recovered_dataset_url)
deaths = pd.read_csv(deaths_dataset_url)
infected = infected.groupby('Country/Region').sum()
recovered = recovered.groupby('Country/Region').sum()
deaths = deaths.groupby('Country/Region').sum()


def mkframe(country):
    df = pd.DataFrame({ 'infected' : infected.loc[country] ,
                        'recovered' : recovered.loc[country],
                        'deaths' : deaths.loc[country]})
    df.index = pd.to_datetime(df.index)
    return df
if 'Lat' in infected or 'Long' in infected:
  infected.drop(columns=['Lat','Long'],inplace=True)
  recovered.drop(columns=['Lat','Long'],inplace=True)
  deaths.drop(columns=['Lat','Long'],inplace=True)

df = mkframe('Japan')
df['ninfected'] = df['infected'].diff()
df['ninfected'].plot()
plt.show()
著者のTWITTERアカウント
ホームページ(pytorch/python/nlp)
参考文献
