はじめに
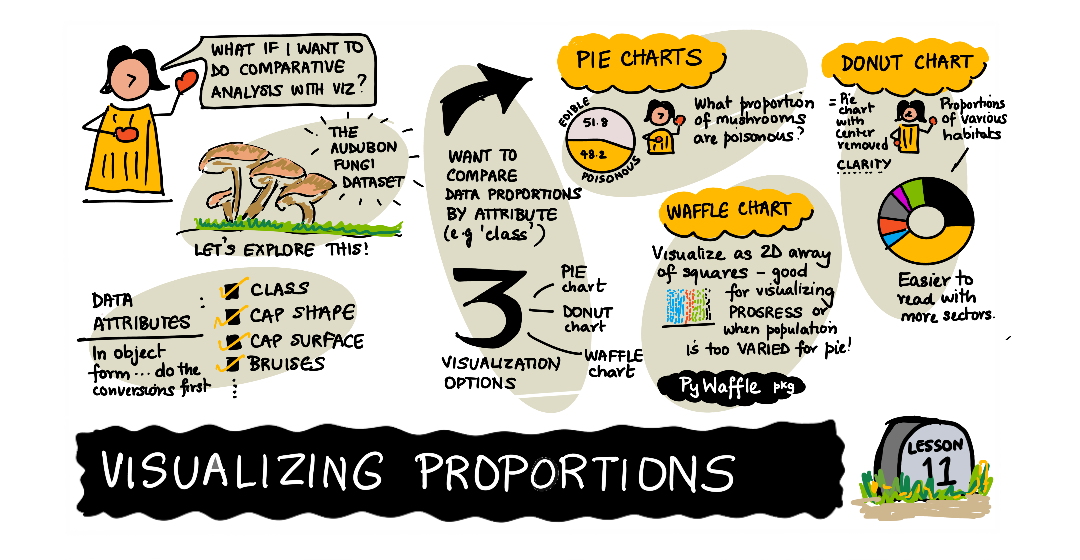
本記事では、Microsoftのデータサイエンス初心者向けコースDay3の"Visualizing Proportion"のPython関連について
Google Colaboratoryを利用して実際に動かしていく。エラーを特定して修正して動かすという体感を通してのみ学びがあると信じている。
対象読者
Pythonとデータサイエンスに興味があって、英語が苦手な人(英語が得意な人は、参考文献を直接解いてね。
きのこについて知る。
import pandas as pd
import matplotlib.pyplot as plt
mushrooms = pd.read_csv('https://raw.githubusercontent.com/microsoft/Data-Science-For-Beginners/main/data/mushrooms.csv')
mushrooms.head()
きのこに関するデータセットの先頭5行を表示。
毒キノコかどうかの列があるので、極性判定とかできそうな感じ。
ラベルをカテゴリのdtypeとして扱い、食べれるキノコと毒キノコの属性を集計。
cols = mushrooms.select_dtypes(["object"]).columns
mushrooms[cols] = mushrooms[cols].astype('category')
edibleclass=mushrooms.groupby(['class']).count()
edibleclass
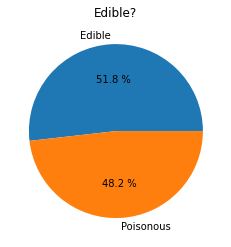
食べれるキノコと毒キノコの割合をパイチャートで。
labels=['Edible','Poisonous']
plt.pie(edibleclass['population'],labels=labels,autopct='%.1f %%')
plt.title('Edible?')
plt.show()
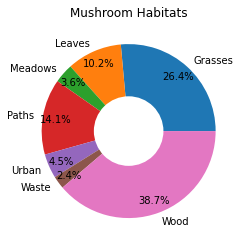
キノコはどこで育つのかをドーナッツチャートで。
habitat=mushrooms.groupby(['habitat']).count()
habitat
labels=['Grasses','Leaves','Meadows','Paths','Urban','Waste','Wood']

plt.pie(habitat['class'], labels=labels,
        autopct='%1.1f%%', pctdistance=0.85)

center_circle = plt.Circle((0, 0), 0.40, fc='white')
fig = plt.gcf()

fig.gca().add_artist(center_circle)

plt.title('Mushroom Habitats')

plt.show()
ワッフルチャート
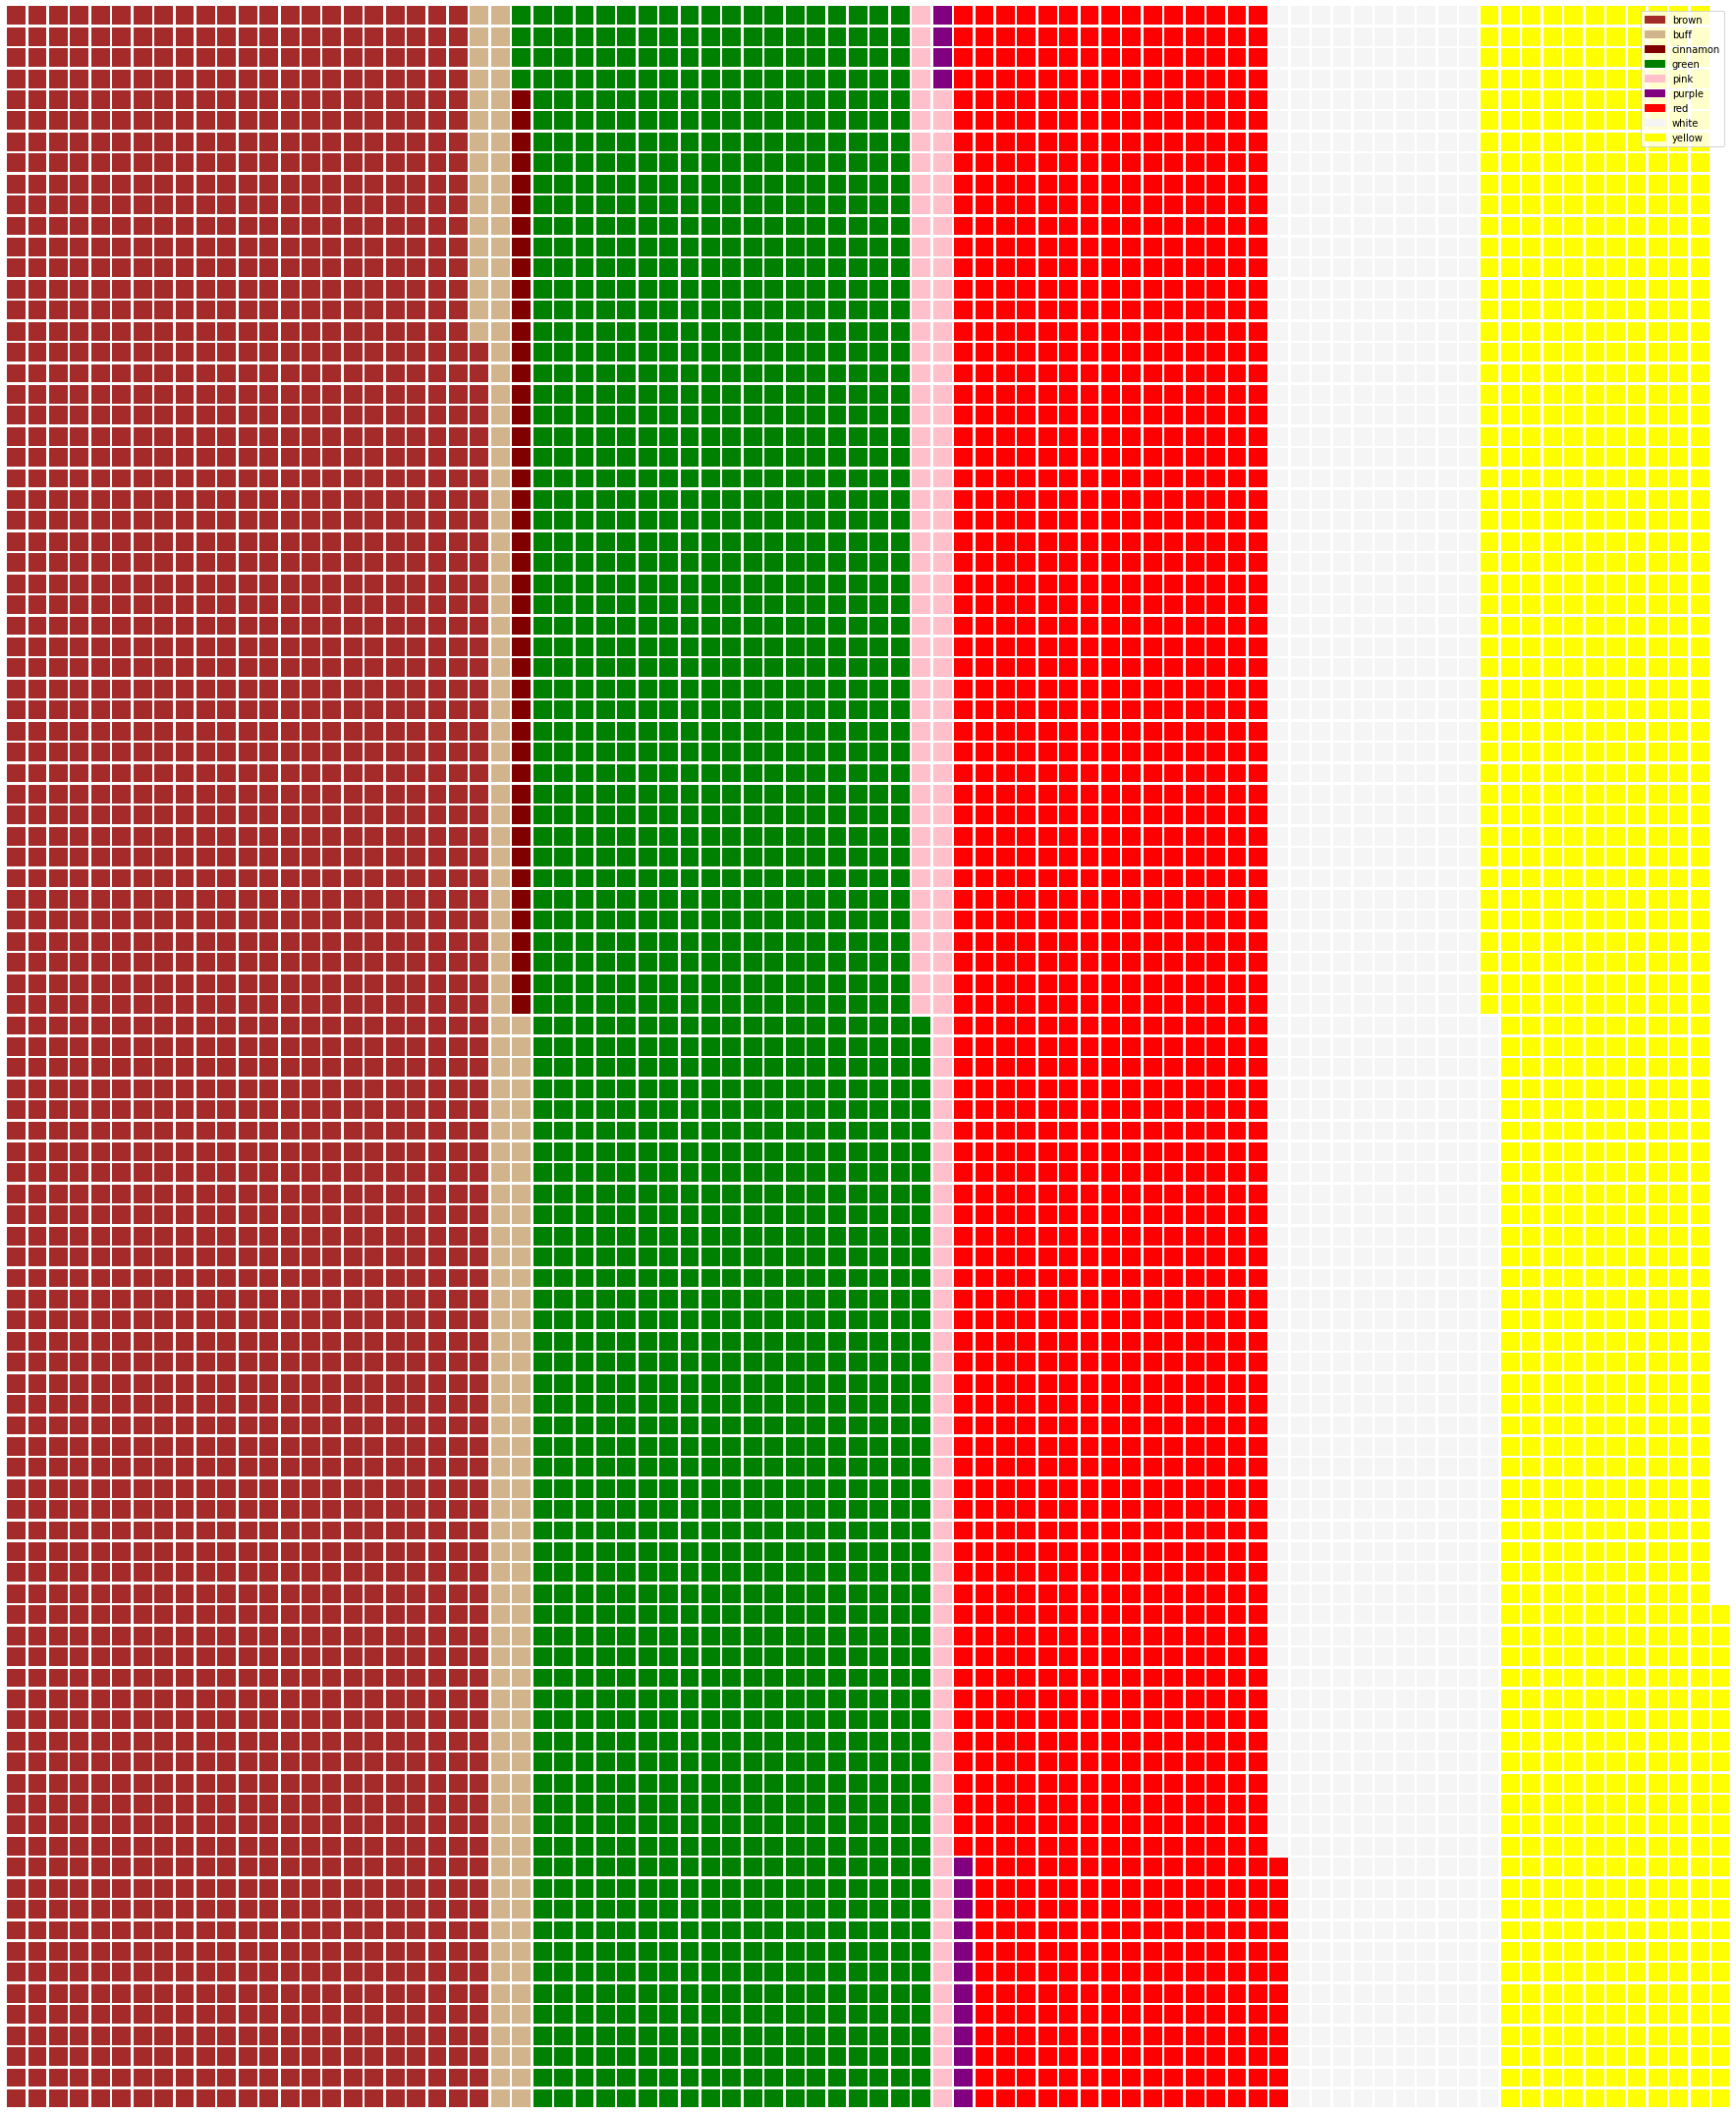
「ワッフル」タイプのチャートは、数量を正方形の2次元配列として可視化する別の方法である。このデータセットで、キノコの傘の色の異なる数量を視覚化してみる。これを行うには、PyWaffleというライブラリをインストールし、Matplotlibを使う必要がある。
pip install pywaffle
import pandas as pd
import matplotlib.pyplot as plt
from pywaffle import Waffle

capcolor=mushrooms.groupby(['cap-color']).count()
capcolor

data ={'color': ['brown', 'buff', 'cinnamon', 'green', 'pink', 'purple', 'red', 'white', 'yellow'],
    'amount': capcolor['class']
     }

df = pd.DataFrame(data)

fig = plt.figure(
    FigureClass = Waffle,
    rows = 100,
    values = df.amount,
    labels = list(df.color),
    figsize = (30,30),
    colors=["brown", "tan", "maroon", "green", "pink", "purple", "red", "whitesmoke", "yellow"],
)
おしゃれなWaffleグラフの出来上がり。ボナペティ!
著者のTWITTERアカウント
ホームページ(pytorch/python/nlp)
参考文献


