こんにちは!( `・∀・´)ノ
この記事は、VALU Advent Calendar 2018 12月21日目のエントリーです。
OMPアルゴリズムとは
OMP(直交マッチング追跡)は、スパースモデリングと言われるもので、送られてきているシグナルがノイズなどで通常の方法ではひとつの解が出せないときに、大きなシグナルから順に一つずつ送られてきている情報を推定できるというアルゴリズムです。スパースというのは、復元したい情報の一部だけが実際に情報を持っていて、多くは0ということです。
機械学習、画像復元、IoTなど色々応用できて面白いなと思ったので、紹介します!
メソッド
例えば、3つのビーコンからそれぞれシグナルs1, s2, s3が送られてきてるとすると、受け取ったシグナルは
\vec{b} = x_1\vec{s_1}+ x_2\vec{s_2}+x_3\vec{s_3}
とかける(x1, x2, x3はそれぞれのシグナルが送りたい情報)。
- 受け取ったシグナルbとs1, s2, s3のドット積をそれぞれ出して、一番大きな値のシグナルを見つける(このシグナルがシグナルbの中に存在することがわかる)
説明のためs1だと仮定
- 最小二乗法を使って、このシグナルに対応するxの値を推定する(s1の場合はx1)
xhat = least_squares(A[:,1], b)
3.次に大きなシグナルを見つけるためには、今見つけた一番大きなシグナルを取り省かないといけないので、残基(residue)を計算する
residue = b - A[:,1].dot(xhat)
4.次に大きなシグナルを見つける(1-3のプロセスを繰り返す)
5.sparsityの数をすべて見つけるか、残基のthresholdを設定してそれを下回ったら終わり
例
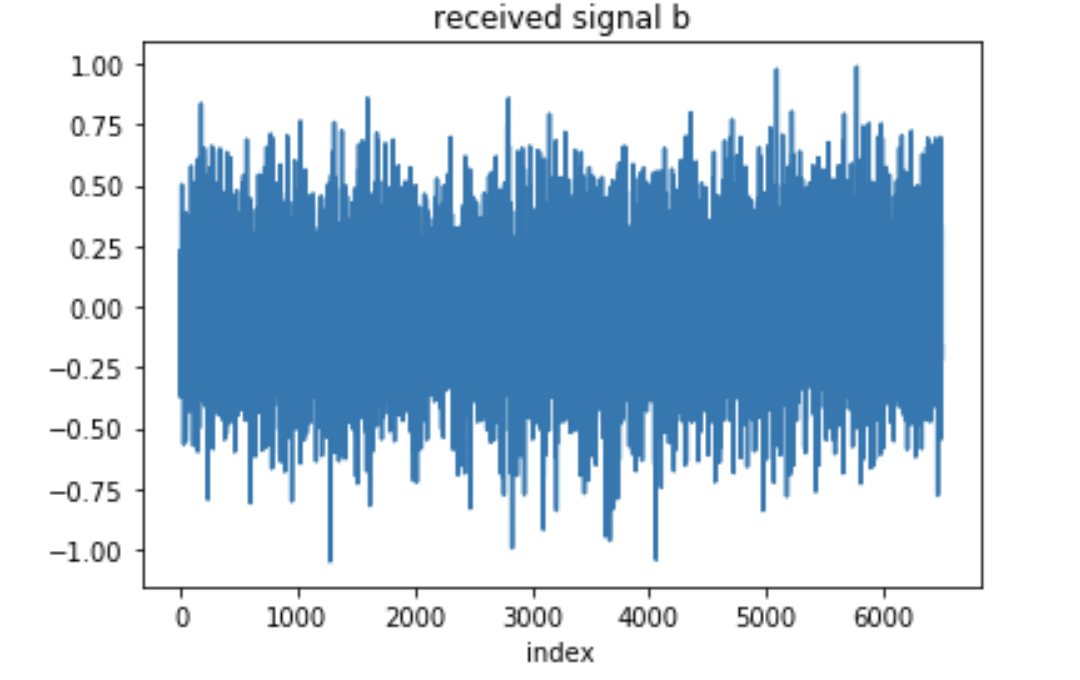
6500個のビーコンがあり、受け取ったシグナルbが下記だとすると

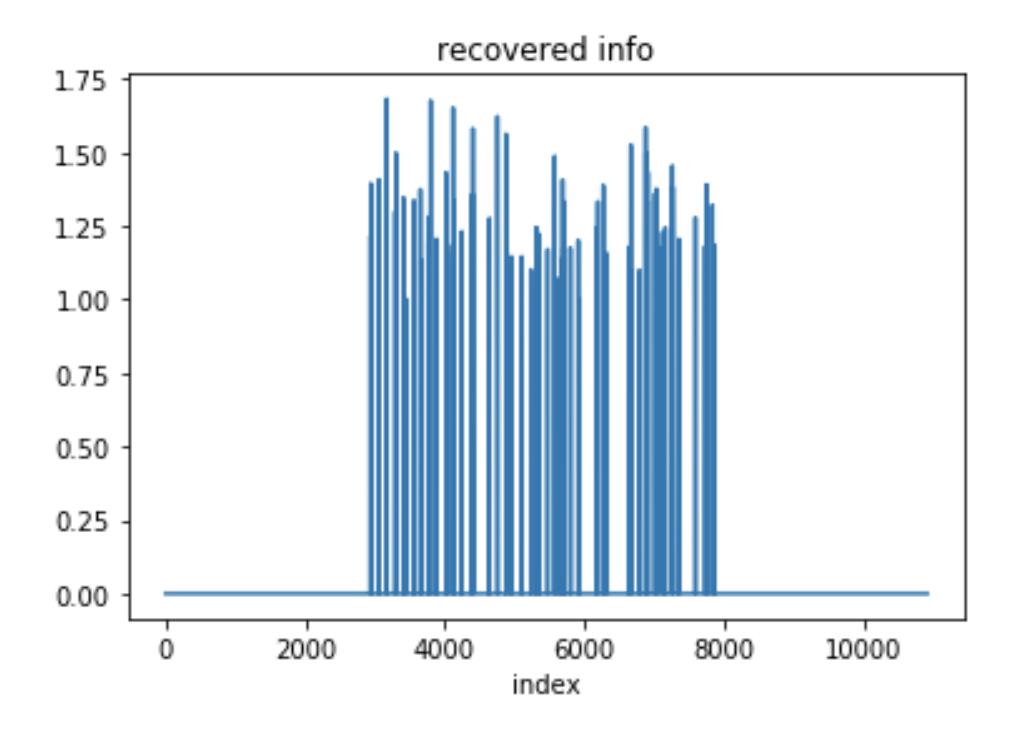
下記のコードを使ってベクターx(送られてきた情報)を見つけられる(100個だけが実際に情報を送っていると仮定 sparsity = 100)
OMPコード
※コードはjupyter notebookでNumPyを使ってます
%pylab inline
import numpy as np
import matplotlib.pyplot as plt
import scipy.io
import sys

def least_squares(A, b):
    return np.linalg.inv(A.T.dot(A)).dot(A.T).dot(b)

def OMP(measurements, A):
    THRESHOLD = 0.1
    SPARSITY = 100
    residue = measurements.copy()
    indices = []
    for _ in range(SPARSITY):
        # find the index of max dot product
        max_index = np.argmax(np.abs(A.T.dot(residue)))
        indices.append(max_index)
        Ahat = A[:,indices]
        b = measurements

        # find the orthogonal projection of the measurements
        # projected onto the column space of Ahat
        xhat = least_squares(Ahat, b)

        # find residue for the next iteration
        residue = b - Ahat.dot(xhat)
        if  np.linalg.norm(residue) <= THRESHOLD:
            break

    #
    recovered_signal = np.zeros(len(A[0]))
    for i, x in zip(indices, xhat):
        recovered_signal[i] = x
    return recovered_signal
sig = OMP(measurements, A)

plt.title('recovered info')
plot(sig)
plt.xlabel('index')
もしこれがそれぞれのピクセルの情報なら、色に変換して画像を復元したり、IoTデバイスでどのuserがデバイスに何を話しかけているのかなど、いろんなモデルに応用できます(実際はもっともっと複雑ですが)。面白い!
※通常は受け取ったシグナルはシフトされてるので、ドット積ではなく、相互相関をつかうことで、max_indexとそのシグナルのシフトがわかります
