こんにちは、kc-dreamです。
今回は、AWSのCloudWatch CustomMetric及びCloudWatch Logsの設定方法についてご紹介していきます。
本記事について
AWS SystemManagerを使用し、CloudWatch Agentをインストールし、各種情報を取得するまでの方法をご紹介します。
※CentOS 7を使用した場合となります。
1,前提条件
CloudWatch エージェントを使用して Amazon EC2 インスタンスとオンプレミスサーバーからメトリクスとログを収集する
確認方法
$ cat /etc/os-release
OSを確認する

$ systemctl list-units --type=service
amazon-ssm-agent.serviceが[active]であればOK
- SystemManager(SSM)がインストールされていなければインストールする
Amazon EC2 Linux インスタンスに SSM エージェント を手動でインストールする
2,IAMロールの作成
- IAMロールを作成し、対象のEC2にアタッチ
- 下記2つのPolicyをロールに付与する
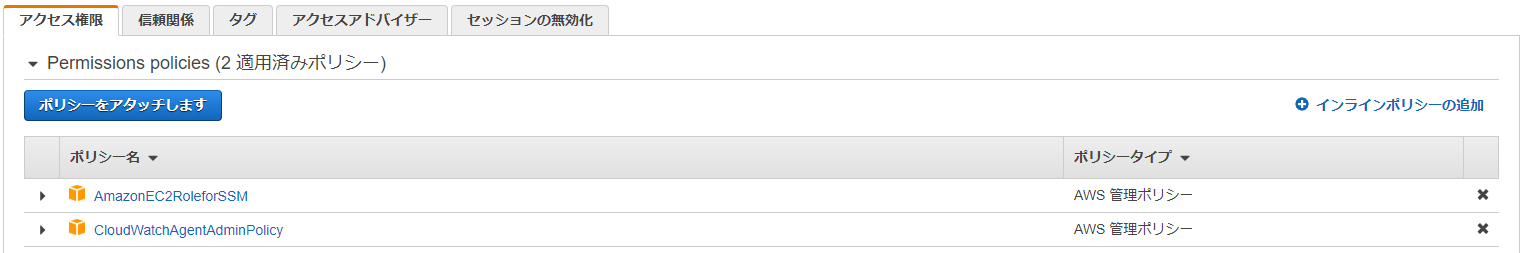
- 下記2つのPolicyをロールに付与する
AmazonEC2RoleforSSM
{
    "Version": "2012-10-17",
    "Statement": [
        {
            "Effect": "Allow",
            "Action": [
                "ssm:DescribeAssociation",
                "ssm:GetDeployablePatchSnapshotForInstance",
                "ssm:GetDocument",
                "ssm:DescribeDocument",
                "ssm:GetManifest",
                "ssm:GetParameters",
                "ssm:ListAssociations",
                "ssm:ListInstanceAssociations",
                "ssm:PutInventory",
                "ssm:PutComplianceItems",
                "ssm:PutConfigurePackageResult",
                "ssm:UpdateAssociationStatus",
                "ssm:UpdateInstanceAssociationStatus",
                "ssm:UpdateInstanceInformation"
            ],
            "Resource": "*"
        },
        {
            "Effect": "Allow",
            "Action": [
                "ssmmessages:CreateControlChannel",
                "ssmmessages:CreateDataChannel",
                "ssmmessages:OpenControlChannel",
                "ssmmessages:OpenDataChannel"
            ],
            "Resource": "*"
        },
        {
            "Effect": "Allow",
            "Action": [
                "ec2messages:AcknowledgeMessage",
                "ec2messages:DeleteMessage",
                "ec2messages:FailMessage",
                "ec2messages:GetEndpoint",
                "ec2messages:GetMessages",
                "ec2messages:SendReply"
            ],
            "Resource": "*"
        },
        {
            "Effect": "Allow",
            "Action": [
                "cloudwatch:PutMetricData"
            ],
            "Resource": "*"
        },
        {
            "Effect": "Allow",
            "Action": [
                "ec2:DescribeInstanceStatus"
            ],
            "Resource": "*"
        },
        {
            "Effect": "Allow",
            "Action": [
                "ds:CreateComputer",
                "ds:DescribeDirectories"
            ],
            "Resource": "*"
        },
        {
            "Effect": "Allow",
            "Action": [
                "logs:CreateLogGroup",
                "logs:CreateLogStream",
                "logs:DescribeLogGroups",
                "logs:DescribeLogStreams",
                "logs:PutLogEvents"
            ],
            "Resource": "*"
        },
        {
            "Effect": "Allow",
            "Action": [
                "s3:GetBucketLocation",
                "s3:PutObject",
                "s3:GetObject",
                "s3:GetEncryptionConfiguration",
                "s3:AbortMultipartUpload",
                "s3:ListMultipartUploadParts",
                "s3:ListBucket",
                "s3:ListBucketMultipartUploads"
            ],
            "Resource": "*"
        }
    ]
}
- AmazonEC2RoleforSSMはSSM Agentを実行するために必要になります。
CloudWatchAgentAdminPolicy
{
    "Version": "2012-10-17",
    "Statement": [
        {
            "Effect": "Allow",
            "Action": [
                "cloudwatch:PutMetricData",
                "ec2:DescribeTags",
                "logs:PutLogEvents",
                "logs:DescribeLogStreams",
                "logs:DescribeLogGroups",
                "logs:CreateLogStream",
                "logs:CreateLogGroup"
            ],
            "Resource": "*"
        },
        {
            "Effect": "Allow",
            "Action": [
                "ssm:GetParameter",
                "ssm:PutParameter"
            ],
            "Resource": "arn:aws:ssm:*:*:parameter/AmazonCloudWatch-*"
        }
    ]
}
3,SSMのRunCommandを使用してCloudWatch Agentをインストール
- SSM コンソールよりSystem Managerメニューに移動し、左側メニューからランコマンドを選択
- 右側のオレンジボタン「コマンドを実行」
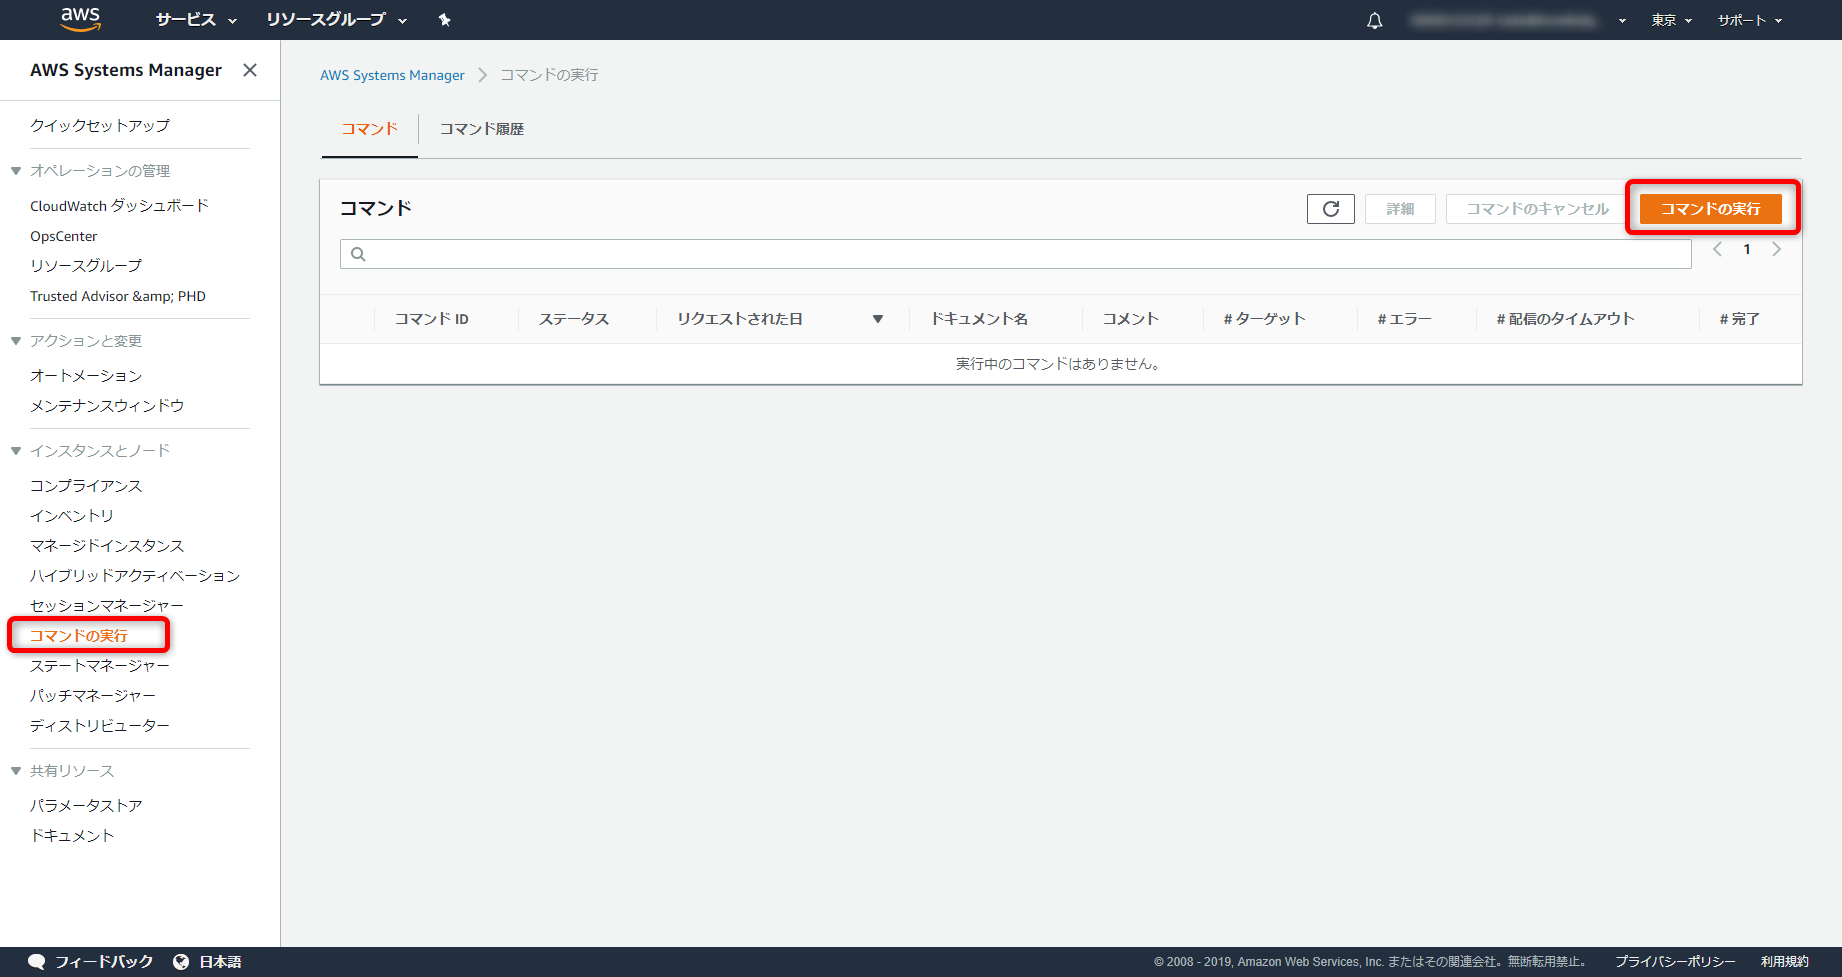
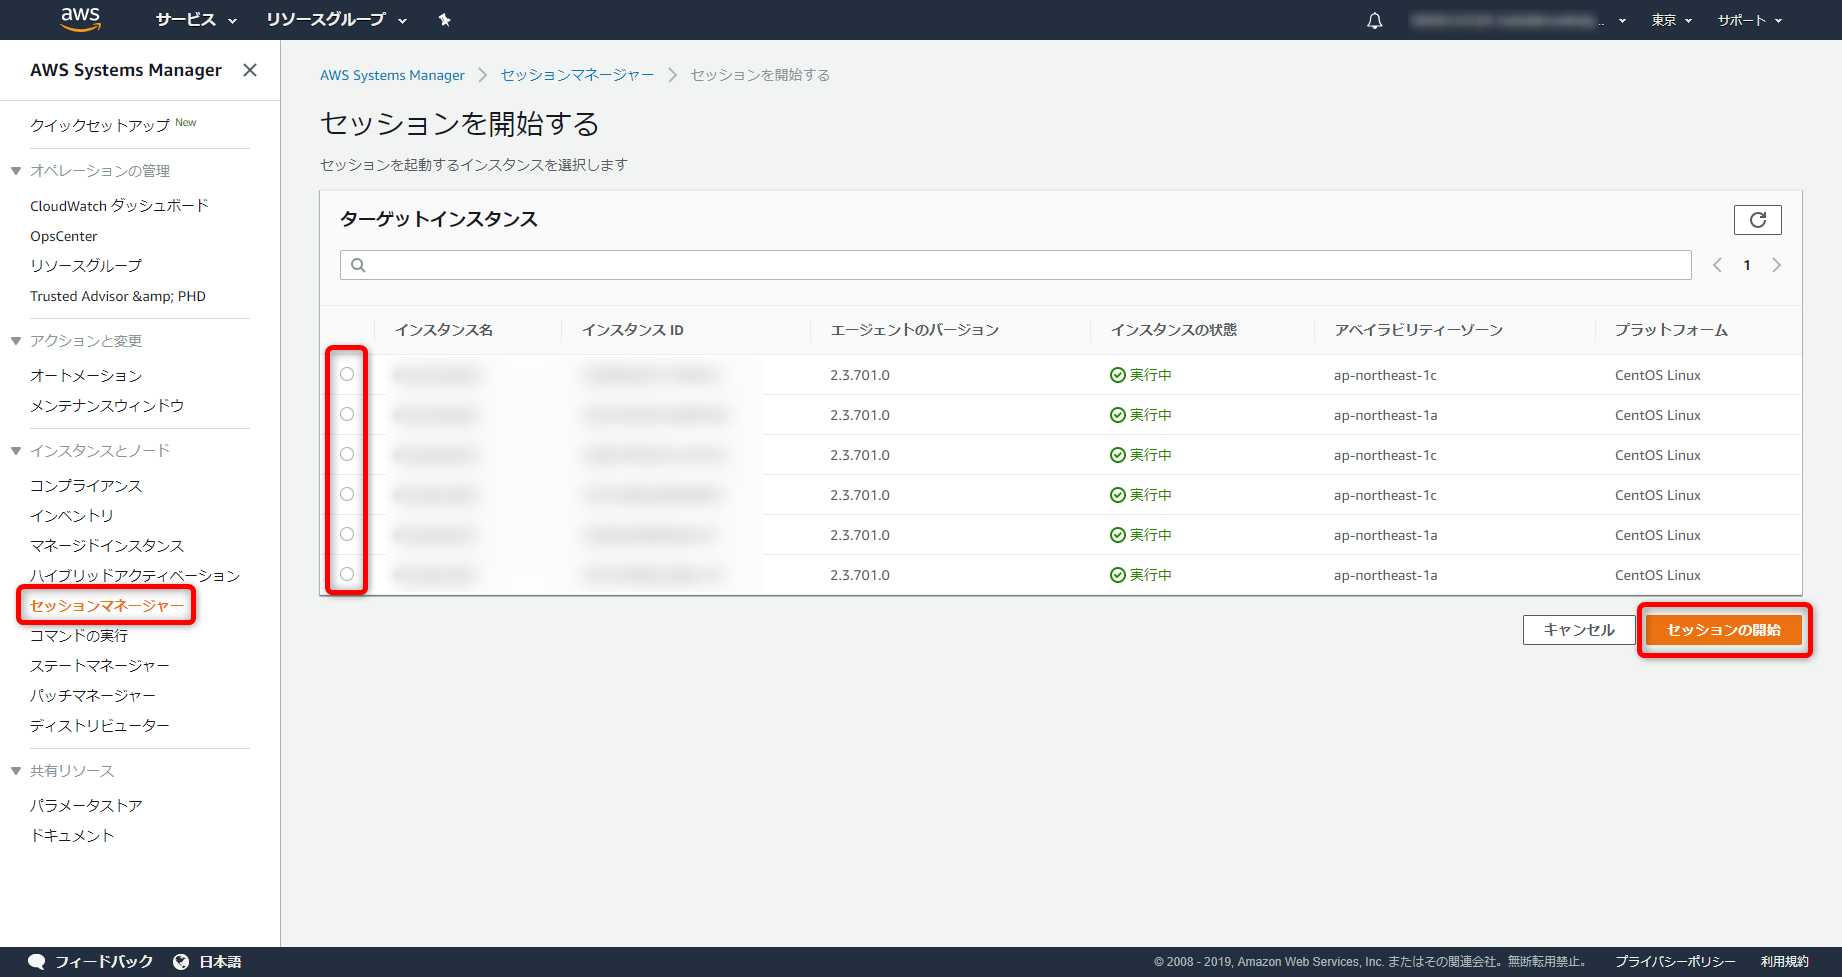
- ターゲットから対象のインスタンスを選択する
(IAMロールが正しく割り当てられているインスタンスが表示されます) - 実行
各種設定情報
コマンドのドキュメント
AWS-ConfigureAWSPackage

コマンドパラメータ
Action:Install
Name:AmazonCloudWatchAgent
Version:latest
4,対象のインスタンスにログイン
- 下記コマンドを実行し、設定情報を選択していきます
コマンド
$ sudo su
# /opt/aws/amazon-cloudwatch-agent/bin/amazon-cloudwatch-agent-config-wizard
=============================================================
= Welcome to the AWS CloudWatch Agent Configuration Manager =
=============================================================
※対象サーバへは、SSMの[セッションマネージャ]を使用し接続することが可能です
(SSMの使用権限が必要)
5,CloudWatch Agent設定項目
Agentを使用するOS
On which OS are you planning to use the agent?
1. linux
2. windows
default choice: [1]:
Agentを使用するサーバはEC2orオンプレ
Trying to fetch the default region based on ec2 metadata...
Are you using EC2 or On-Premises hosts?
1. EC2
2. On-Premises
default choice: [1]:
Agentを実行するユーザ
Which user are you planning to run the agent?
1. root
2. cwagent
3. others
default choice: [1]:
StatsDデーモンを有効or無効
Do you want to turn on StatsD daemon?
1. yes
2. no
default choice: [1]:
StatsDデーモンで使用するポート
Which port do you want StatsD daemon to listen to?
default choice: [8125]
StatsDデーモンのデータ収集間隔
What is the collect interval for StatsD daemon?
1. 10s
2. 30s
3. 60s
default choice: [1]:
StatsDデーモンのデータ集約間隔
What is the aggregation interval for metrics collected by StatsD daemon?
1. Do not aggregate
2. 10s
3. 30s
4. 60s
default choice: [4]:
collectDの収集
Do you want to monitor metrics from CollectD?
1. yes
2. no
default choice: [1]:2
メトリクスの収集
Do you want to monitor any host metrics? e.g. CPU, memory, etc.
1. yes
2. no
default choice: [1]:
CPUコア単位での使用率取得(追加費用発生の可能性有)
Do you want to monitor cpu metrics per core? Additional CloudWatch charges may apply.
1. yes
2. no
default choice: [1]:
ImageId/InstanceId/InstanceType/AutoScalingGroupNameを取得可能であれば取得
Do you want to add ec2 dimensions (ImageId, InstanceId, InstanceType, AutoScalingGroupName) into all of your metrics if the info is available?
1. yes
2. no
default choice: [1]:
メトリクスの取得間隔
Would you like to collect your metrics at high resolution (sub-minute resolution)? This enables sub-minute resolution for all metrics, but you can customize for specific metrics in the output json file.
1. 1s
2. 10s
3. 30s
4. 60s
default choice: [4]:
取得するメトリクスの種類
Which default metrics config do you want?
1. Basic
2. Standard
3. Advanced
4. None
default choice: [1]:3
上記で選択した取得するメトリクスの内容
Current config as follows:
{
        "agent": {
                "metrics_collection_interval": 60,
                "run_as_user": "root"
        },
        "metrics": {
                "append_dimensions": {
                        "AutoScalingGroupName": "${aws:AutoScalingGroupName}",
                        "ImageId": "${aws:ImageId}",
                        "InstanceId": "${aws:InstanceId}",
                        "InstanceType": "${aws:InstanceType}"
                },
                "metrics_collected": {
                        "collectd": {
                                "metrics_aggregation_interval": 60
                        },
                        "cpu": {
                                "measurement": [
                                        "cpu_usage_idle",
                                        "cpu_usage_iowait",
                                        "cpu_usage_user",
                                        "cpu_usage_system"
                                ],
                                "metrics_collection_interval": 60,
                                "resources": [
                                        "*"
                                ],
                                "totalcpu": false
                        },
                        "disk": {
                                "measurement": [
                                        "used_percent",
                                        "inodes_free"
                                ],
                                "metrics_collection_interval": 60,
                                "resources": [
                                        "*"
                                ]
                        },
                        "diskio": {
                                "measurement": [
                                        "io_time",
                                        "write_bytes",
                                        "read_bytes",
                                        "writes",
                                        "reads"
                                ],
                                "metrics_collection_interval": 60,
                                "resources": [
                                        "*"
                                ]
                        },
                        "mem": {
                                "measurement": [
                                        "mem_used_percent"
                                ],
                                "metrics_collection_interval": 60
                        },
                        "netstat": {
                                "measurement": [
                                        "tcp_established",
                                        "tcp_time_wait"
                                ],
                                "metrics_collection_interval": 60
                        },
                        "statsd": {
                                "metrics_aggregation_interval": 60,
                                "metrics_collection_interval": 10,
                                "service_address": ":8125"
                        },
                        "swap": {
                                "measurement": [
                                        "swap_used_percent"
                                ],
                                "metrics_collection_interval": 60
                        }
                }
        }
}
取得するメトリクスは上記でいいか
Are you satisfied with the above config? Note: it can be manually customized after the wizard completes to add additional items.
1. yes
2. no
default choice: [1]:
CloudWatchLogs使用しているか
Do you have any existing CloudWatch Log Agent (http://docs.aws.amazon.com/AmazonCloudWatch/latest/logs/AgentReference.html) configuration file to import for migration?
1. yes
2. no
default choice: [2]:
取得したいログファイルはあるか
Do you want to monitor any log files?
1. yes
2. no
default choice: [1]:
取得したいログファイルをフルパスで指定
Log file path:/var/log/httpd/access_log
ロググループ名を指定
Log group name:
default choice: [access_log]
ログストリーム名を指定
Log stream name:
default choice: [{instance_id}]
追加取得したいログファイルはあるか
Do you want to specify any additional log files to monitor?
1. yes
2. no
default choice: [1]:2
取得するメトリクスとログファイルの内容(内容を修正する場合はSSMコンソールのパラメータストアを編集)
Saved config file to /opt/aws/amazon-cloudwatch-agent/bin/config.json successfully.
Current config as follows:
{
        "agent": {
                "metrics_collection_interval": 60,
                "run_as_user": "root"
        },
        "logs": {
                "logs_collected": {
                        "files": {
                                "collect_list": [
                                        {
                                                "file_path": "/opt/tomcat/logs/access.log",
                                                "log_group_name": "access.log",
                                                "log_stream_name": "@@@@@"
                                        },
                                        {
                                                "file_path": "/var/log/httpd/error_log",
                                                "log_group_name": "errorlog",
                                                "log_stream_name": "@@@@@"
                                        },
                                        {
                                                "file_path": "/var/log/httpd/access_log",
                                                "log_group_name": "access_log",
                                                "log_stream_name": "@@@@@"
                                        }
                                ]
                        }
                }
        },
        "metrics": {
                "append_dimensions": {
                        "AutoScalingGroupName": "${aws:AutoScalingGroupName}",
                        "ImageId": "${aws:ImageId}",
                        "InstanceId": "${aws:InstanceId}",
                        "InstanceType": "${aws:InstanceType}"
                },
                "metrics_collected": {
                        "collectd": {
                                "metrics_aggregation_interval": 60
                        },
                        "cpu": {
                                "measurement": [
                                        "cpu_usage_idle",
                                        "cpu_usage_iowait",
                                        "cpu_usage_user",
                                        "cpu_usage_system"
                                ],
                                "metrics_collection_interval": 60,
                                "resources": [
                                        "*"
                                ],
                                "totalcpu": false
                        },
                        "disk": {
                                "measurement": [
                                        "used_percent",
                                        "inodes_free"
                                ],
                                "metrics_collection_interval": 60,
                                "resources": [
                                        "*"
                                ]
                        },
                        "diskio": {
                                "measurement": [
                                        "io_time",
                                        "write_bytes",
                                        "read_bytes",
                                        "writes",
{
                                        "reads"
                                ],
                                "metrics_collection_interval": 60,
                                "resources": [
                                        "*"
                                ]
                        },
                        "mem": {
                                "measurement": [
                                        "mem_used_percent"
                                ],
                                "metrics_collection_interval": 60
                        },
                        "netstat": {
                                "measurement": [
                                        "tcp_established",
                                        "tcp_time_wait"
                                ],
                                "metrics_collection_interval": 60
                        },
                        "statsd": {
                                "metrics_aggregation_interval": 60,
                                "metrics_collection_interval": 10,
                                "service_address": ":8125"
                        },
                        "swap": {
                                "measurement": [
                                        "swap_used_percent"
                                ],
                                "metrics_collection_interval": 60
                        }
                }
        }
}
Please check the above content of the config.
The config file is also located at /opt/aws/amazon-cloudwatch-agent/bin/config.json.
Edit it manually if needed.
SSMのパラメータストアに設定ファイルを保持しますか
Do you want to store the config in the SSM parameter store?
1. yes
2. no
default choice: [1]:
パラメータストアの設定ファイル名を指定(先頭に"AmazonCloudWatch-"を必ず使用/ユニークで指定するのがいい)
What parameter store name do you want to use to store your config? (Use 'AmazonCloudWatch-' prefix if you use our managed AWS policy)
default choice: [AmazonCloudWatch-linux]
AmazonCloudWatch-@@@@
設定ファイルを保持するリージョンを指定
Trying to fetch the default region based on ec2 metadata...
Which region do you want to store the config in the parameter store?
default choice: [ap-northeast-1]
SSMパラメータストアにデータを送信するのにアクセスキーを使用するか
Which AWS credential should be used to send json config to parameter store?
1. ASIABBBCCC111222DD33(From SDK)
2. Other
default choice: [1]:
保存に成功するとSSMコンソールのパラメータストアに保存されているので確認
Successfully put config to parameter store AmazonCloudWatch-fi-gridadm.
Program exits now.
6,CloudWatch Agentの有効化
パラメータストアの設定ファイル読み込み
# /opt/aws/amazon-cloudwatch-agent/bin/amazon-cloudwatch-agent-ctl -a fetch-config -m ec2 -c ssm:AmazonCloudWatch-@@@@ -s
CloudWatchAgentのステータス確認
# systemctl status amazon-cloudwatch-agent.service
CloudWatchAgentの自動起動有効化
# systemctl is-enabled amazon-cloudwatch-agent.service
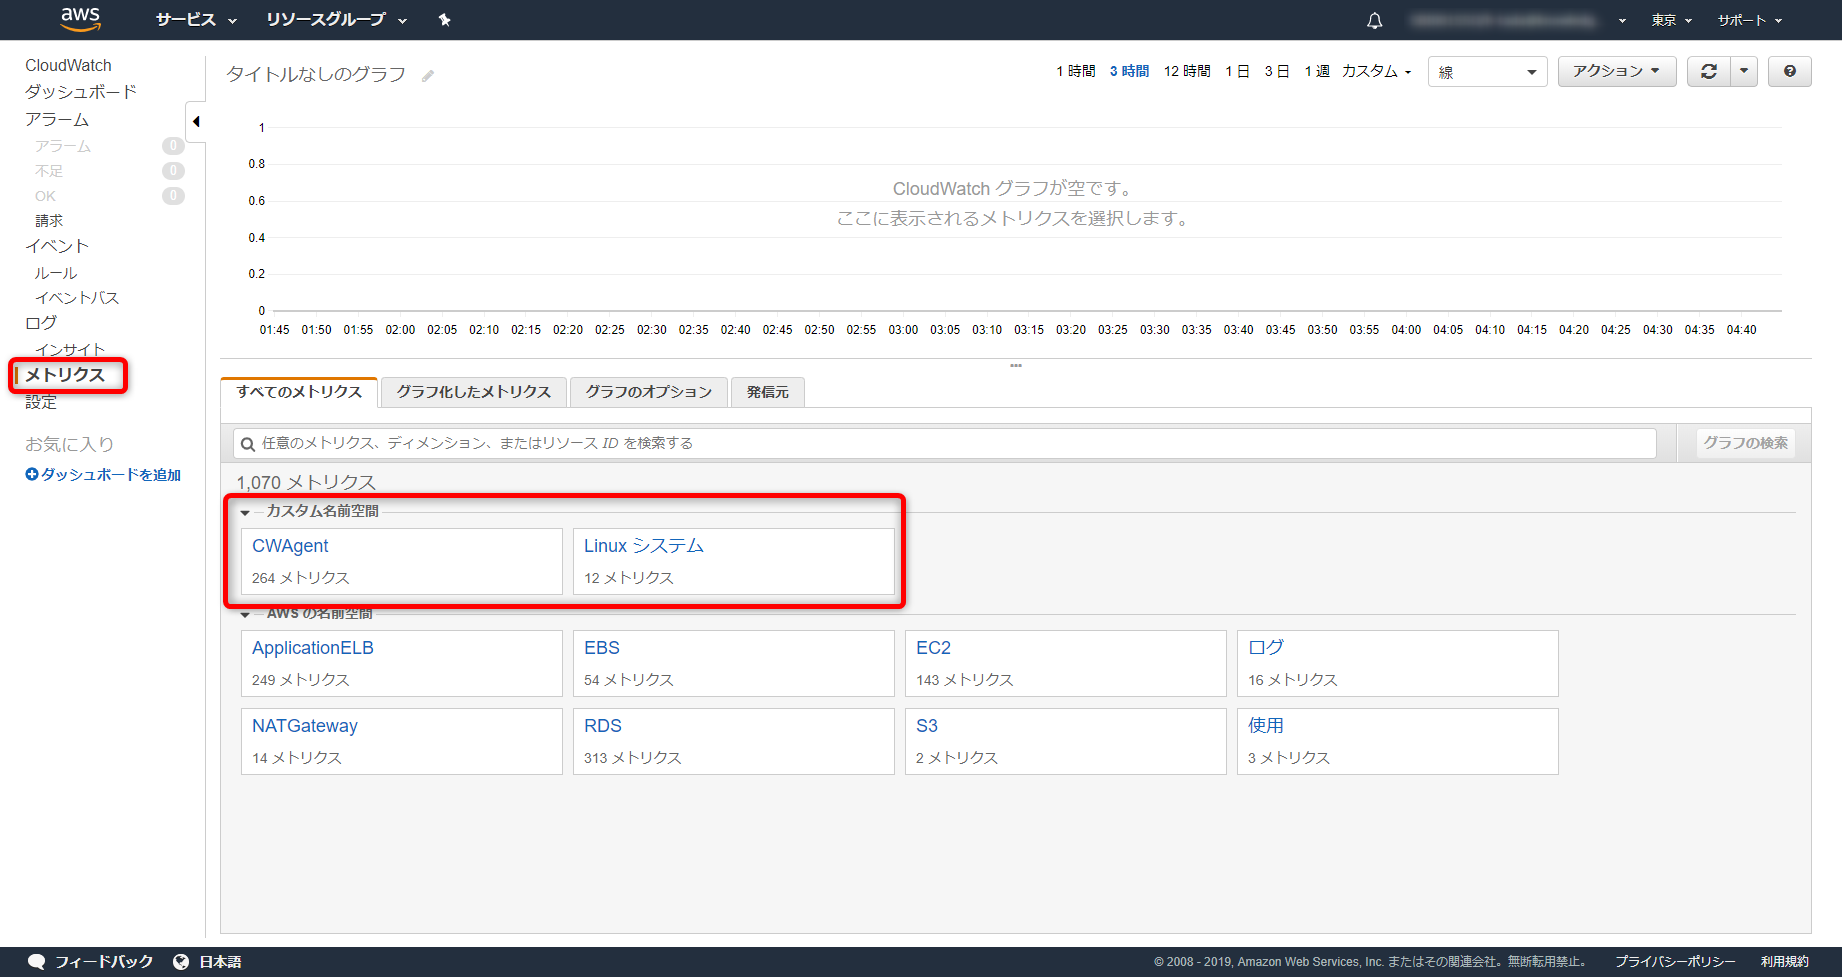
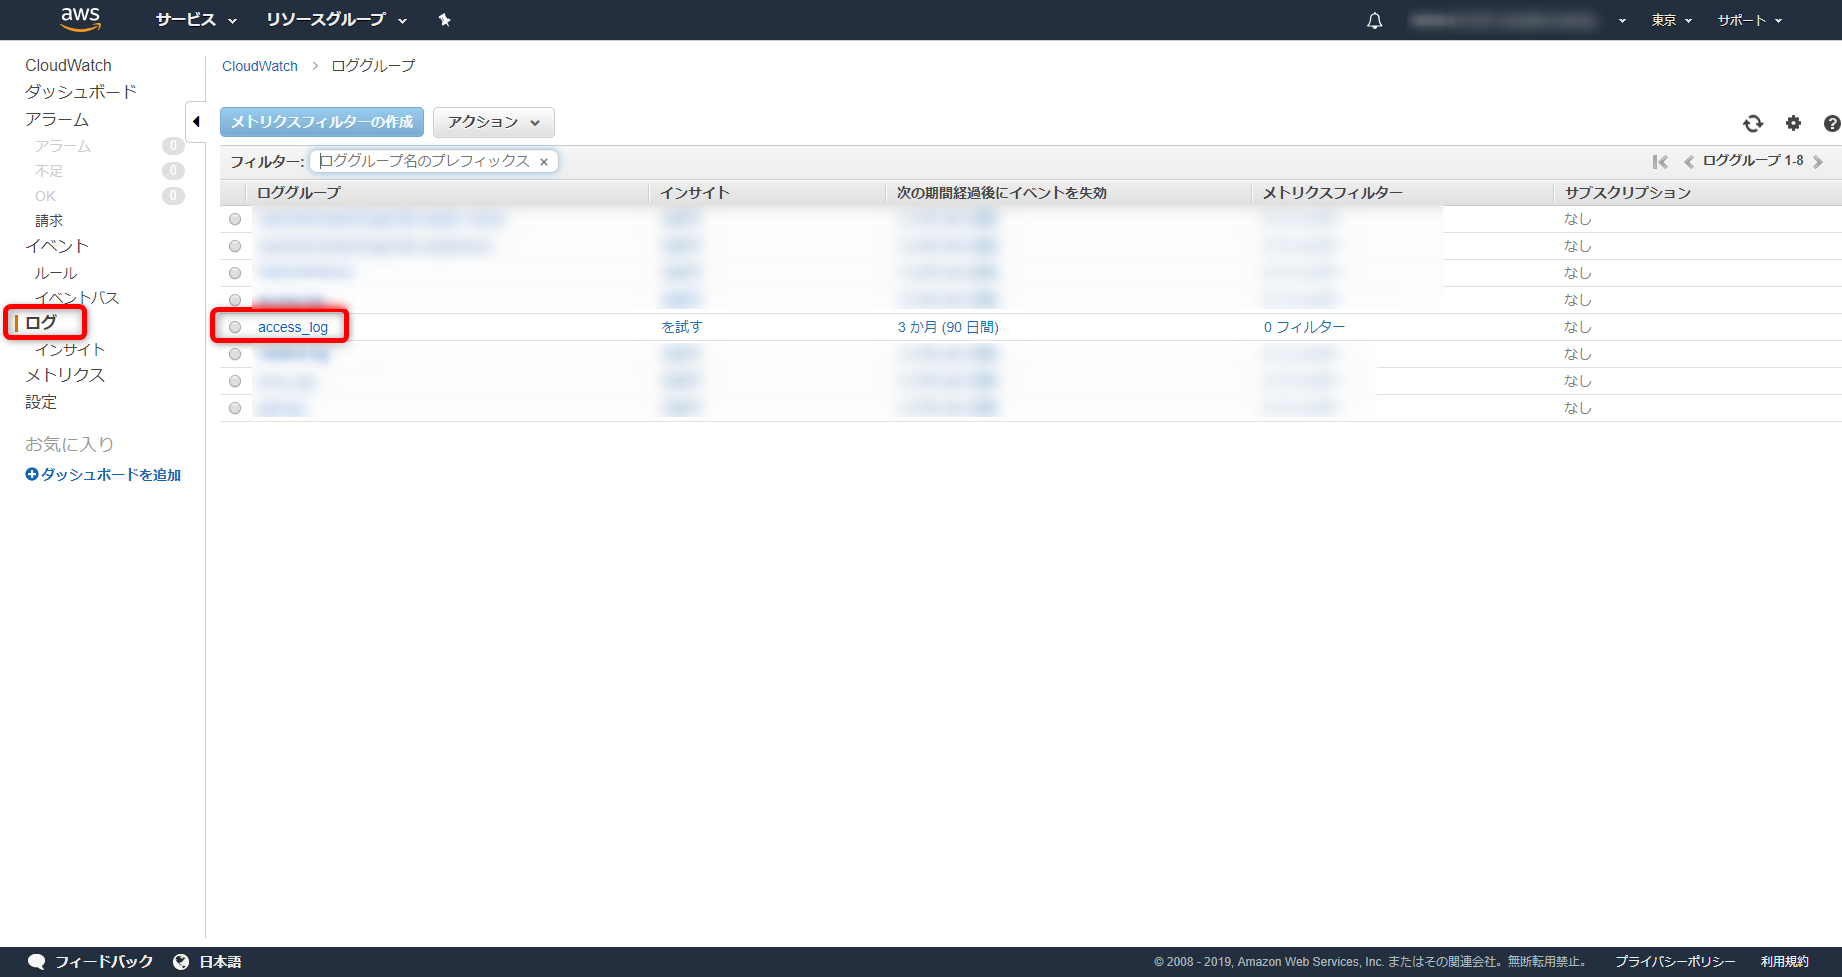
7,AWSコンソールのCloudWatchからCustomMetric及びLogが取得できているかを確認
参考URL
collectDが導入されてるか:collectD設定方法
取得するメトリクスの種類:ウィザードを使用してCloudWatchエージェント設定ファイルを作成する