2020/0604
- もっとよく知りたい方はこちらへ
- ラズパイがよく止まるので、AWS Lambdaに移しました
- 記事を書く余力が無いので、時間があれば投稿します
TL;DR
- Bitfinex&Coinlendでどれだけ稼げてるか可視化する仕組みを作ってみました
- 投資、投機、仮想通貨売買、レンディングを行う際は自己責任でお願いします。
- 本記事は特定の投資などを推進するものではありません。また責任も負えません。
- 全体像イメージ
- 最近買った、Rocketbookで手書きしてみましたw
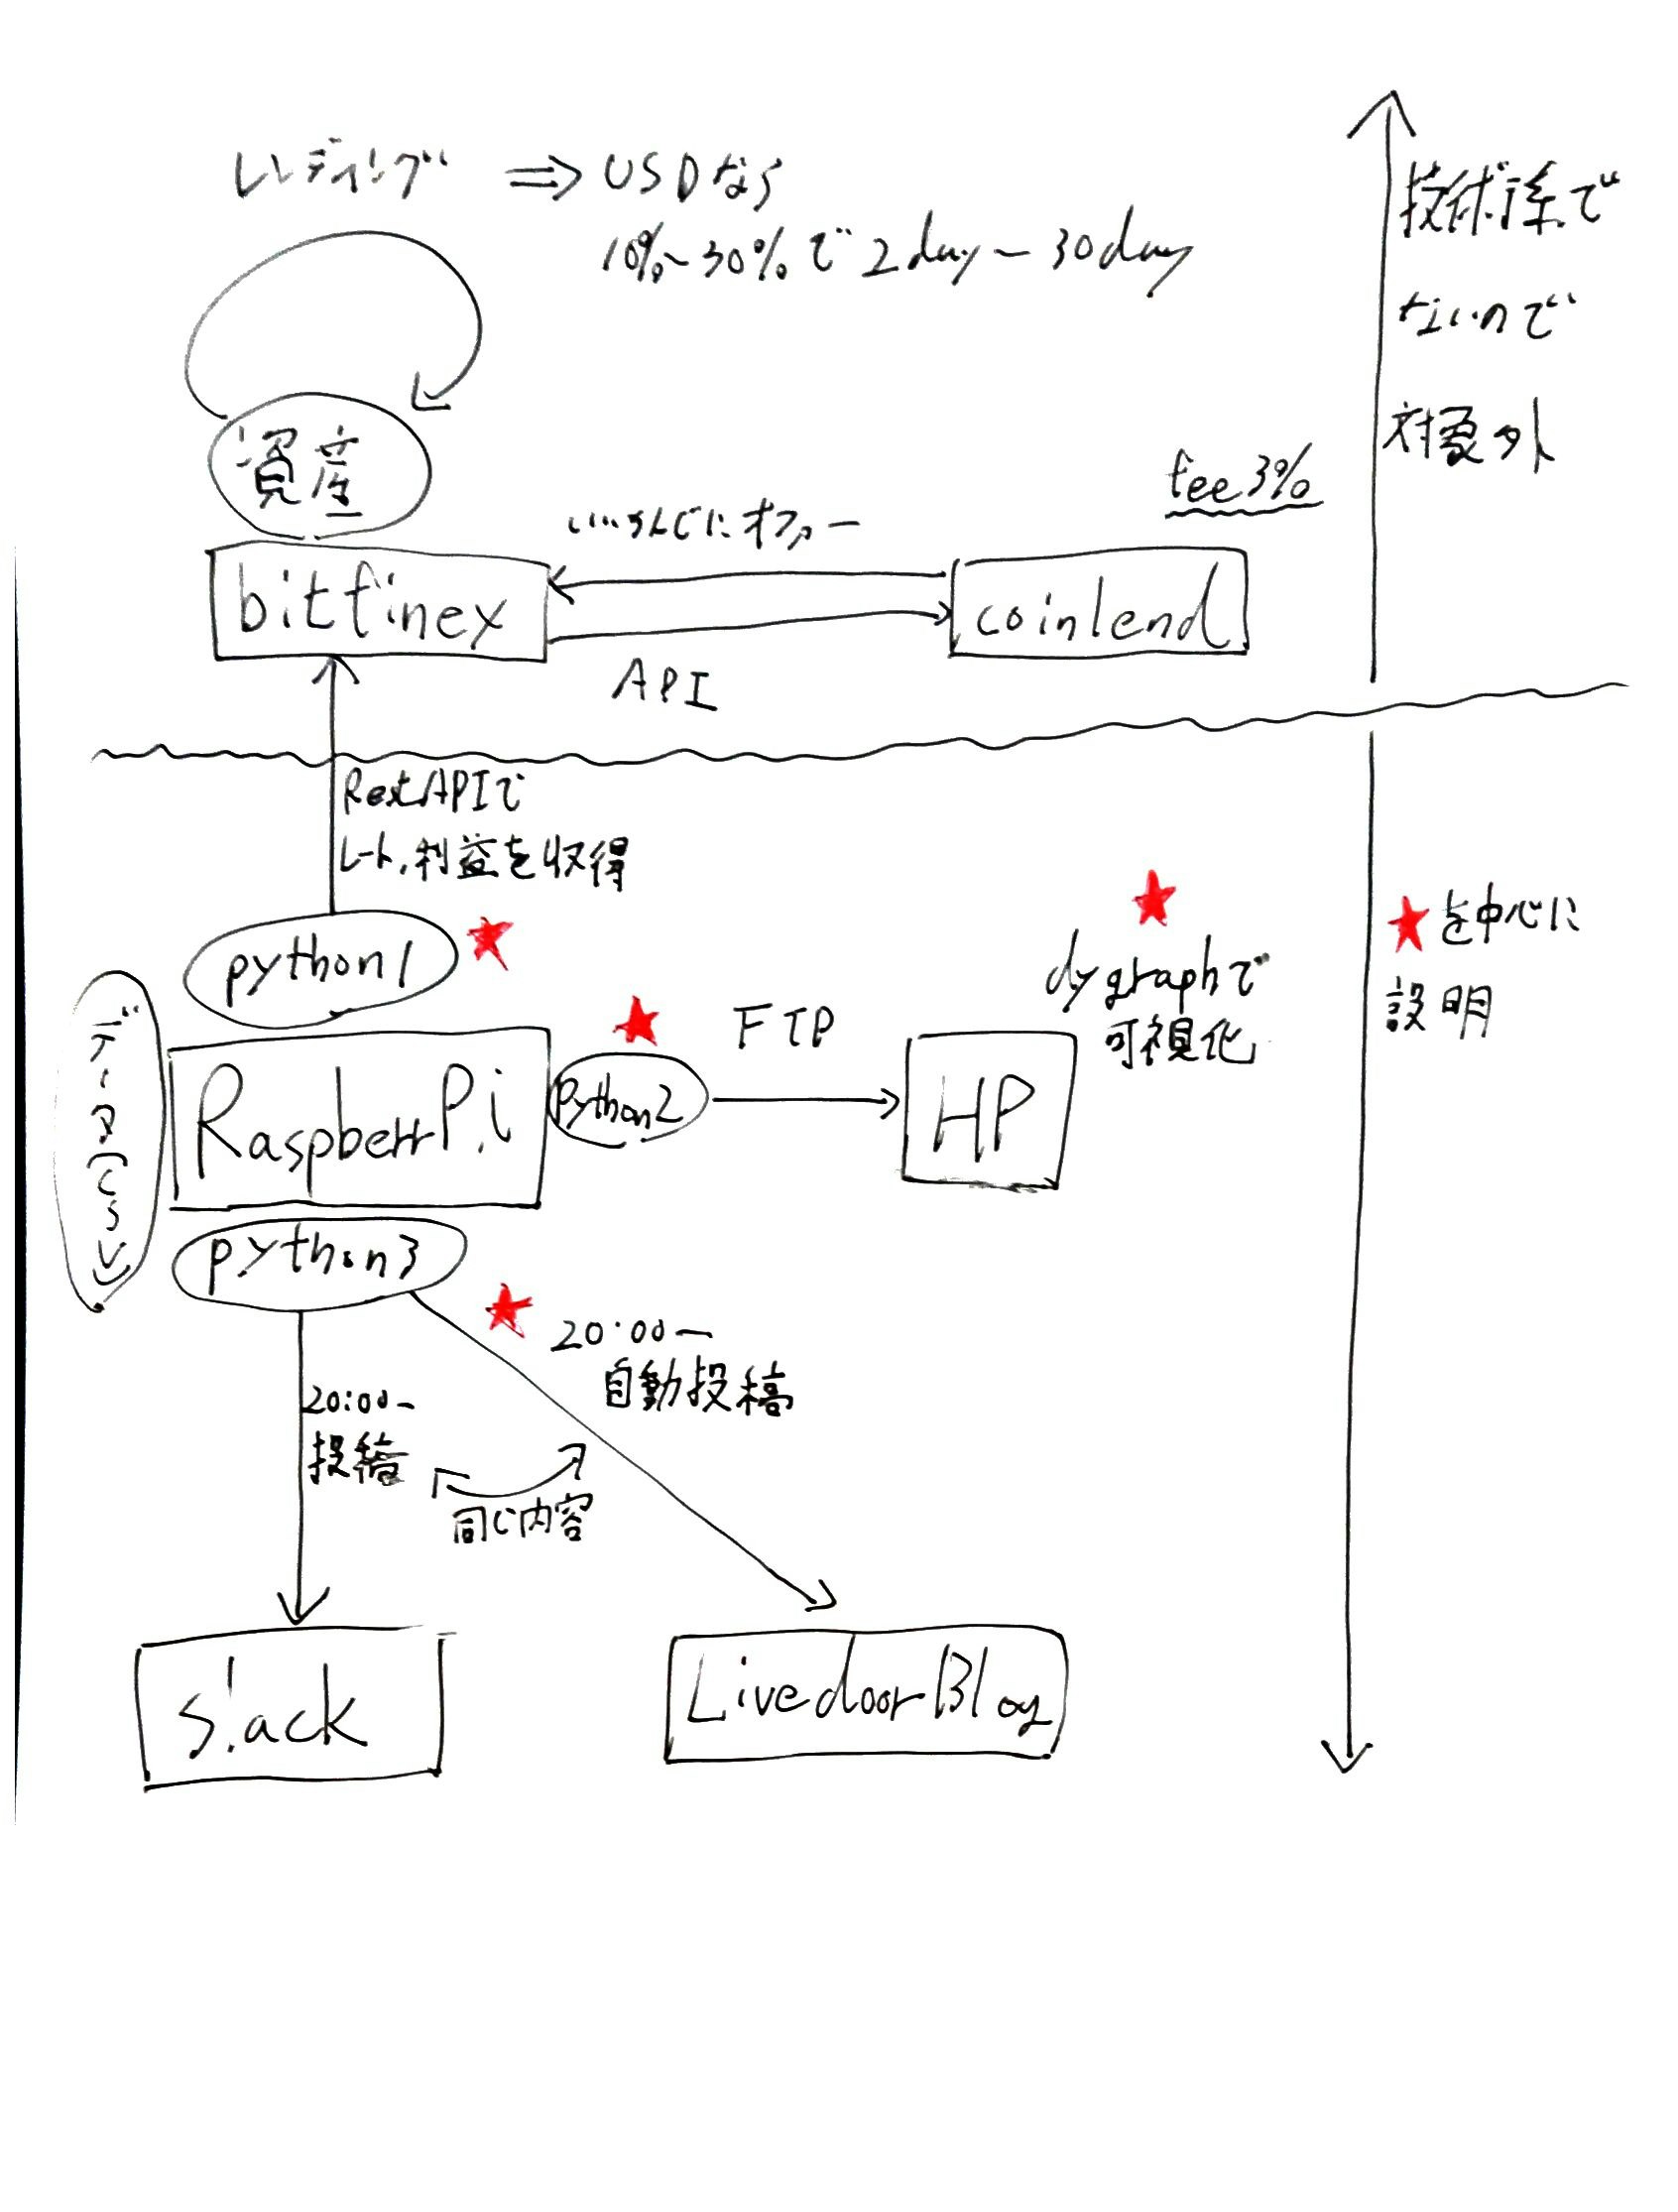
- 最近買った、Rocketbookで手書きしてみましたw
BitFinex&Coinlendを簡単にご説明
- Bitfinex:仮想通貨の取引所。仮想通貨だけでなくUSDなど法定通貨のレンディング(貸し出し)もできる
- Coinlend:BitFinexの資産やレートを監視して、いい感じにオファーを出すBOTを提供してくれる
- レンディングレートはかなり増減するので、追従して分散して指定しておいたオプションに従って自動で貸し出しをしてくれる
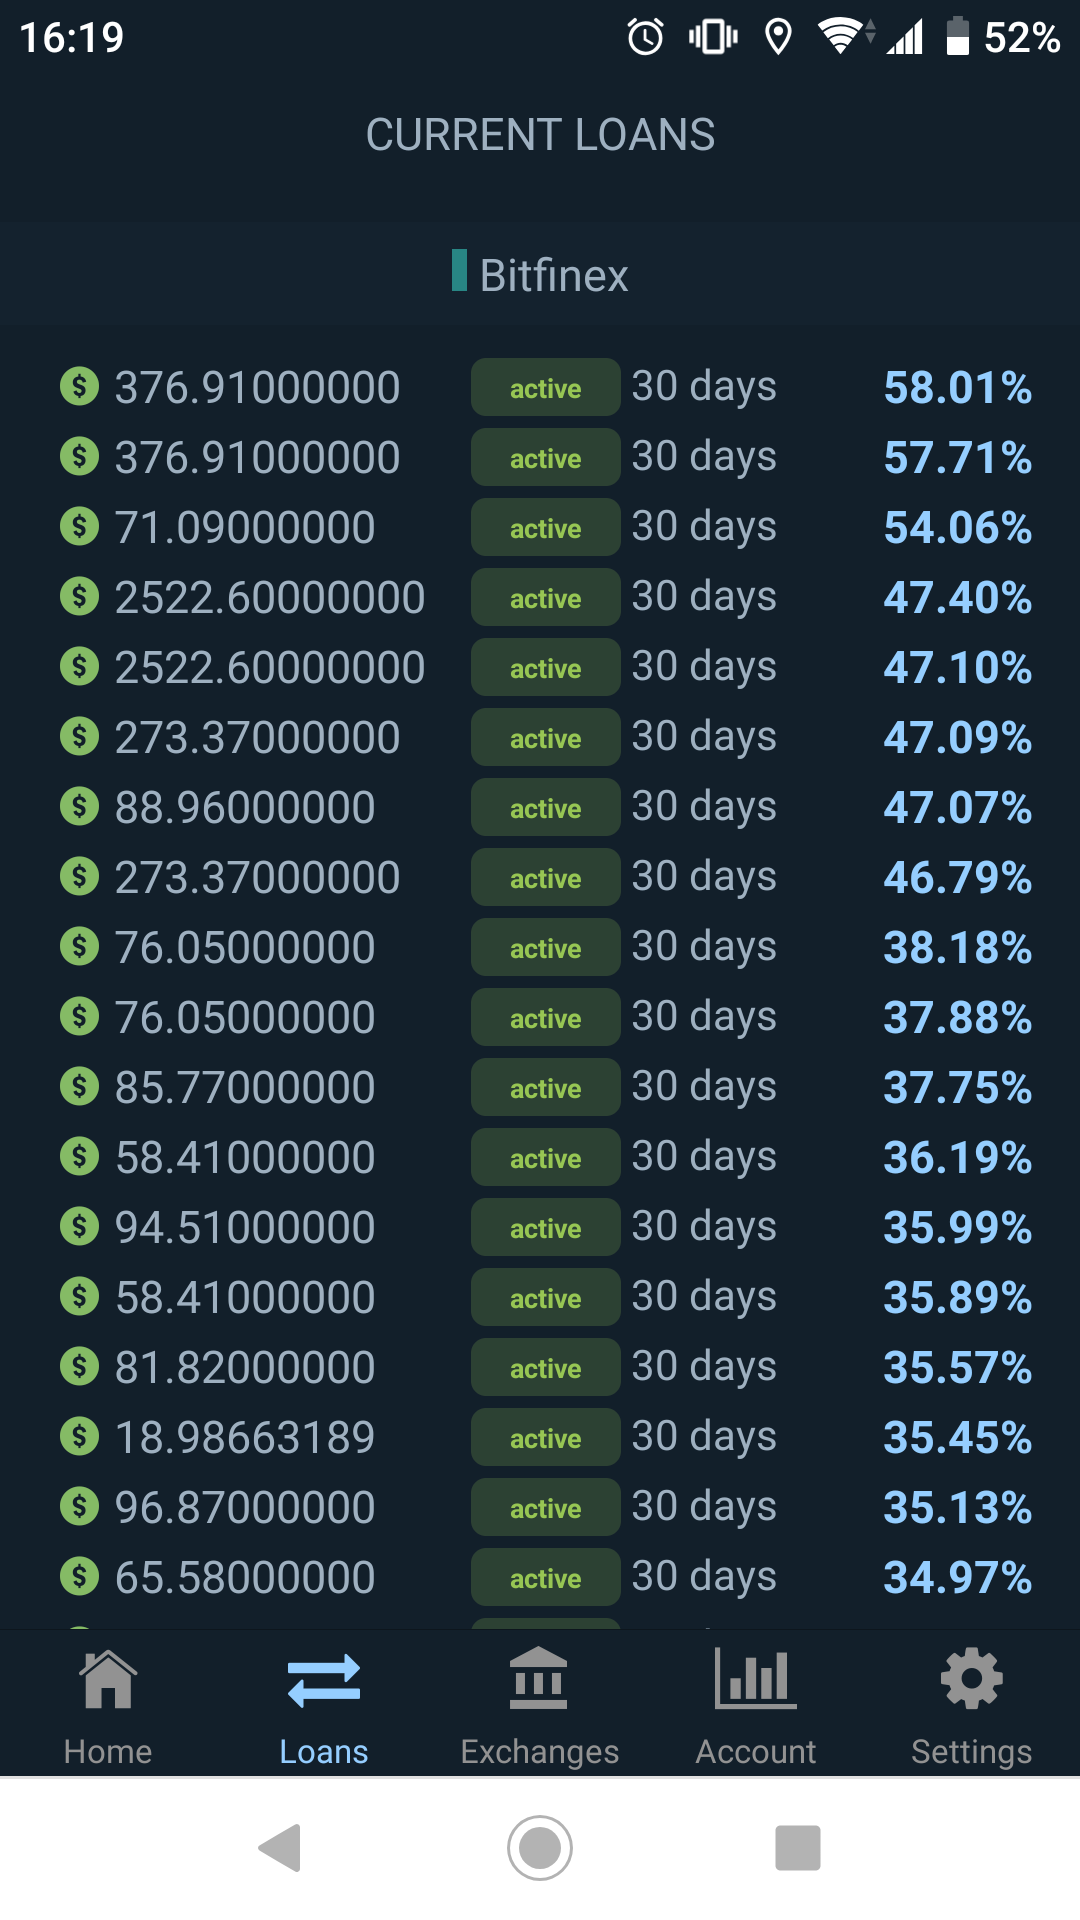
※ 適当にとったスクリーンショットだったのですが、ここ最近まれに見るほど高騰したレートになっています。普段は30%を超えることは稀です。
Part1:Bitfinexから必要な情報を取得する
- 本題に戻りまして、上記のレンディング状況を可視化したいと考えました
- coinlendで設定(下限のレートや一定のレートを超えたらもっと長く貸せるなど)などを細かく変更したいためです。
- Coinlendなどでもhistoryやreportはあるのですが、ぱっと見れる次のようなグラフが欲しくなりました。
- 法定通貨(USD,EUR,JPY)の10分毎の1日のレート
- 法定通貨(USD,EUR,JPY)の1日平均毎の1日のレート
- 日々の収入の推移
そこで、以下のような情報が必要になります
- その時点でのUSD,EUR,JPYのレートの取得
- 取得の間隔と可視化範囲を工夫して、10分毎/1日毎のレートを作成
- 現在の資産と日毎の利益
- これはBitfinexで生成されるAPIから取得します
Bitfinexには、APIが公開されているため、これを活用します
https://docs.bitfinex.com/docs
1の方は認証がいらないpublicなAPIを使います
class Rate:

    def getRateUSD(self):
        result = requests.get('https://api-pub.bitfinex.com/v2/trades/fUSD/hist?limit=1')
        usd =  round(result.json()[0][3] * 365 * 100,2)
        return usd
    def getRateJPY(self):
        result = requests.get('https://api-pub.bitfinex.com/v2/trades/fJPY/hist?limit=1')
        jpy =  round(result.json()[0][3] * 365 * 100,2)
        return jpy
    def getRateEUR(self):
        result = requests.get('https://api-pub.bitfinex.com/v2/trades/fEUR/hist?limit=1')
        eur =  round(result.json()[0][3] * 365 * 100,2)
        return eur
2の方は認証のためにKEY,SECRETを設定する必要がありますが、公式サイトにテンプレートを応用して作成しました。
import requests
import json
import hashlib
import hmac
import time

class BitfinexClient(object):
    BASE_URL = "https://api.bitfinex.com/"
    KEY=""
    SECRET=""

    def _nonce(self):
        """
        Returns a nonce
        Used in authentication
        """
        return str(int(round(time.time() * 1000)))

    def _headers(self, path, nonce, body):

        signature = "/api/" + path + nonce + body
        #print "Signing: " + signature
        h = hmac.new(self.SECRET.encode('utf8'), signature.encode('utf8'), hashlib.sha384)
        signature = h.hexdigest()

        return {
            "bfx-nonce": nonce,
            "bfx-apikey": self.KEY,
            "bfx-signature": signature,
            "content-type": "application/json"
        }

    def active_wallets(self):
        """
        Fetch active wallets
        """
        nonce = self._nonce()
        body = {}
        rawBody = json.dumps(body)
        path = "v2/auth/r/ledgers/USD/hist"

        headers = self._headers(path, nonce, rawBody)
        r = requests.post(self.BASE_URL + path, headers=headers, data=rawBody, verify=True)

        if r.status_code == 200:
          return r.json()
        else:
          print r.status_code
          print r
          return ''
※ここにKEY,SECRETを設定し、jsonをパースして、必要な情報を拾います
あとは、これをcronで10分おきに取得し、csvにappendしていきます。
Part2:HPで情報を可視化する
作ったものはこちら
http://tech.kazutxt.com/coinlend/page/chart.html
データを蓄積するところまでは、part1で行いますので、
part2では、csvをFTPでサーバに送る作業と、サーバ側で可視化する作業の2つを行います。
まず、FTPSによってサーバにデータを送信します。
これはpart1と連続して実施することで、10分毎の概ねリアルタイムの情報を連携できます。
from ftplib import FTP_TLS

# 設定
class MySftp:
    FTP_SERVER = ''
    FTP_USER = ''
    FTP_PASSWORD = ''
    UPLOAD_PATH = ""
    LOCAL_DIR = ""

    def send(self,path,filename):
        ftps = FTP_TLS(self.FTP_SERVER)
        ftps.login(self.FTP_USER, self.FTP_PASSWORD)
        ftps.prot_p()
        ftps.set_pasv('true')
        ftps.cwd(self.UPLOAD_PATH)
        with open(path, 'rb') as f:
            ftps.storbinary('STOR ' + filename, f)
        ftps.quit()
ちなみに、レンタルサーバは、ロリポップを使っています。
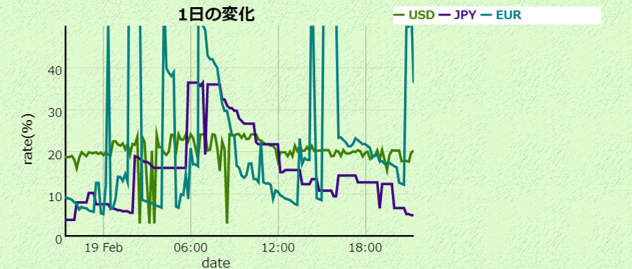
次に、可視化の部分はdygraphという時系列の可視化に強いライブラリを使っています。
ひとまずやっつけなので、動けばOKの初期装備です。
(これからも、色々カスタマイズする予定の発展途上です。。。)
データソースとオプションで必要な情報を与えます。
レートは1つのファイルでひたすら10分おきに追記しておき、1日や1ヶ月は期間を調整して同じデータを使い、表示しています。
	var daily_start_day = new Date();
	daily_start_day.setDate(daily_start_day.getDate() - 1);
	var monthly_start_day = new Date();
	monthly_start_day.setDate(monthly_start_day.getDate() - 30);
	var today = new Date();


	// 1日の変化
    g = new Dygraph(
      document.getElementById("daily"), // div
      "../data/hour.csv", // data
      {                                    // option 指定
        legend: 'always',                  // 凡例常表示
        title: '1日の変化',
        xlabel: 'date',
        ylabel: 'rate(%)',
        valueRange: [0,50],                 // yスケール指定
        axisLineWidth:3.0,
        strokeWidth:3.0,
        labels: [ "Date", "USD", "JPY","EUR" ],
        dateWindow:[daily_start_day,today]
      }
    );

    //1ヶ月の変化
        g2 = new Dygraph(
      document.getElementById("montly"), // div
      "../data/monthly.csv", // data
      {                                    // option 指定
        legend: 'always',                  // 凡例常表示
        title: '1ヶ月の変化',
        xlabel: 'date',
        ylabel: 'rate(%)',
        axisLineWidth:3.0,
        strokeWidth:3.0,
        valueRange: [0,50],                 // yスケール指定
        labels: [ "Date", "USD", "JPY","EUR" ],
        dateWindow:[monthly_start_day,today]
      }
    );

    g3 = new Dygraph(
      document.getElementById("interest"), // div
      "../data/hour.csv", // data
      {                                    // option 指定
        legend: 'always',                  // 凡例常表示
        title: '利益推移',
        xlabel: 'date',
        ylabel: 'USD($)',
        y2label : 'parcent(yearly)',
        axisLineWidth:3.0,
        strokeWidth:3.0,
        labels: [ "Date", "interest", "interest_parcent" ],
        series: {
              'interest_parcent': {
                axis: 'y2'
              }
            }
      }
    );
画像イメージ
Part3:BlogにDailyReportを自動起稿する(+Slackも)
最後に、日々どれだけ儲かったかを個人用のSlackと公開用のブログに投稿します。
実際のブログ:http://blog.livedoor.jp/kazutxt-vc/
(Slackについては山程記事があるので省略します)
ブログ(Livedoorブログ)にも通知します
https://qiita.com/shin27/items/edfc7e28081c5604d8cc などを参考にさせていただきました。
調べたところ、RESTAPIでJSONを送れば良いのようなものはなく、atompubというAPIでXMLを送信することで自動起稿できます。
class Livedoor:
    XML_TEMPLATE = """
    <entry xmlns="http://www.w3.org/2005/Atom"
        xmlns:app="http://www.w3.org/2007/app"
        xmlns:blogcms="http://blogcms.jp/-/spec/atompub/1.0/">
        <title>{title}</title>
        <blogcms:source>
            <blogcms:body><![CDATA[<p>{entry}</p>]]></blogcms:body>
        </blogcms:source>
        <category scheme="http://livedoor.blogcms.jp/staff/category" term="自動投稿" />
    </entry>
    """
    USER_ID = ''
    ENDPOINT = ''
    API_KEY = ''


    def create_wsse(self):
        created = datetime.datetime.now().isoformat() + "Z"
        b_nonce = hashlib.sha1(str(random.random()).encode()).digest()
        b_digest = hashlib.sha1(b_nonce + created.encode() + self.API_KEY.encode()).digest()
        s = 'UsernameToken Username="{0}", PasswordDigest="{1}", Nonce="{2}", Created="{3}"'
        return s.format(self.USER_ID, base64.b64encode(b_digest).decode(), base64.b64encode(b_nonce).decode(), created)


    def post_entry(self,blog_title, blog_entry):
        header = {
            'X-WSSE': self.create_wsse()
        }
        requests.post(
            self.ENDPOINT,
            headers=header,
            data=self.XML_TEMPLATE.format(title=blog_title, entry=blog_entry)
        )
最後に
- ラズパイがSPOFなので、止まったら全部が記録できなくなりますw