(2016/03/06追記 ggplot2 v2.1.0でも以下のコードが動作することを確認しました)
Q1
ggplot2を使って積み重ねの縦棒グラフを描くと、このようになります:
require(ggplot2)
p <- ggplot(diamonds, aes(cut, fill = clarity)) +
  geom_bar()
p
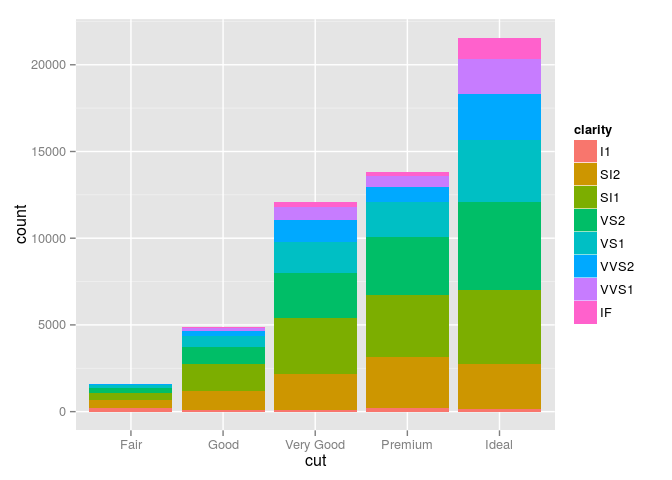
しかし、これだと積み重ねの順番と凡例の順番が逆になります。凡例を逆順にしたいのですがどうすればいいでしょうか?
A1
guide_legend(reverse = TRUE)を活用すると逆順になります:
p <- ggplot(diamonds, aes(cut, fill = clarity)) +
  geom_bar() +
  guides(fill = guide_legend(reverse = TRUE))
p
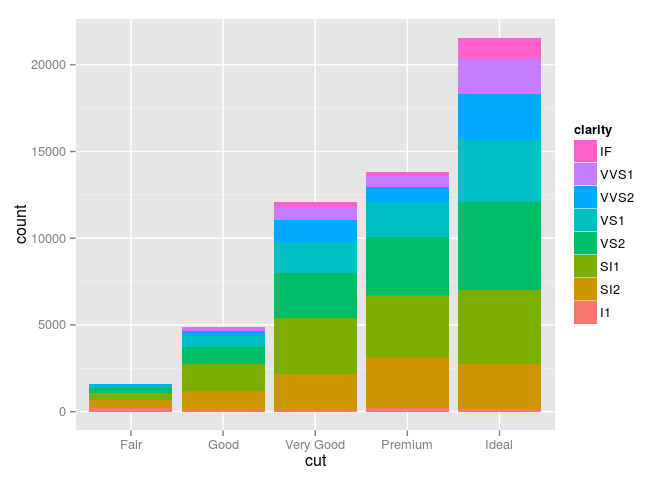
このguides(fill = guide_legend(reverse = TRUE))によって、aes(fill = )で指定したfactorの順番が逆順となります。aes(colour = )で指定したfactorについては、以下のようにしてください:
p <- ggplot(diamonds, aes(cut, colour = clarity)) +
  geom_bar(fill = "white") +
  guides(colour = guide_legend(reverse = TRUE))
p
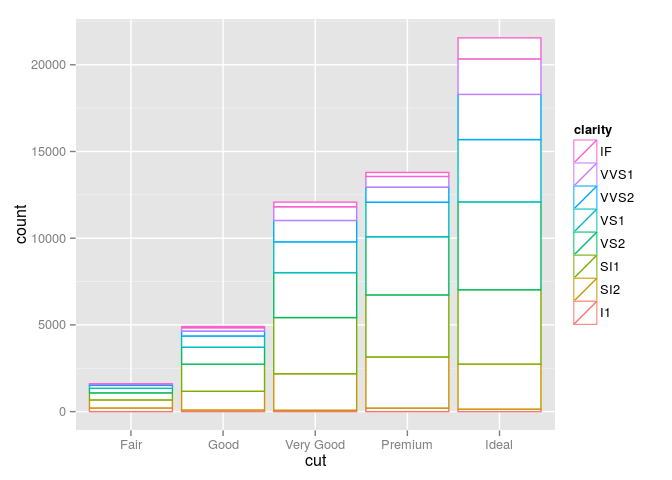
これらは棒グラフ以外でも有効です。ただし、凡例(legend)内の順序が反転するだけです。
Q2
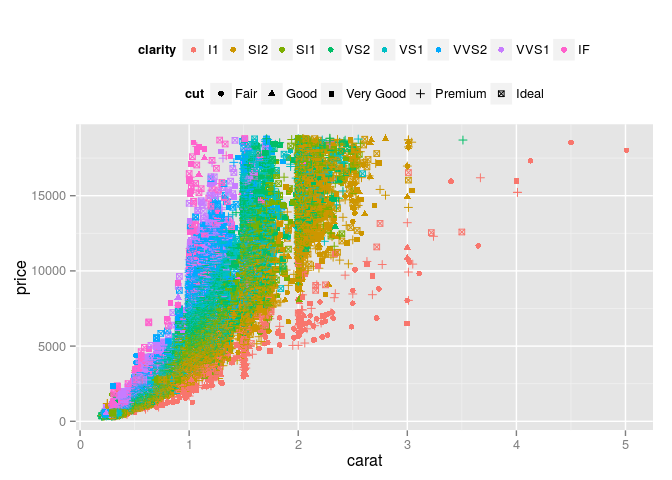
ggplot2で、「色と形」というように凡例に表示させるものが2種類以上ある場合、その変数の順番は変更できるのでしょうか。例えば以下のような場合です:
p <- ggplot(diamonds, aes(carat, price, colour = clarity, shape = cut)) +
  geom_point() +
  theme(legend.position = "top")
p

このとき、オプションを指定する順番を入れ替えたり、shapeとcolourで指定する変数を入れ替えたりしても、必ずcutが上にくるようになります。これを入れ替える方法はあるのでしょうか?
A2
version 0.9.2より、guide_legend(order = )で順番を指定することができます:
p <- ggplot(diamonds, aes(carat, price, colour = clarity, shape = cut)) +
  geom_point() +
  theme(legend.position = "top") +
  guides(shape = guide_legend(order = 2),
         colour = guide_legend(order = 1))
p
p + guides(shape = guide_legend(order = 1),
         colour = guide_legend(order = 2))

なおguide_legendとしているように、設定があたるのは凡例(legend)だけです。
Q3 (コメント指摘より2015/8/2に追記)
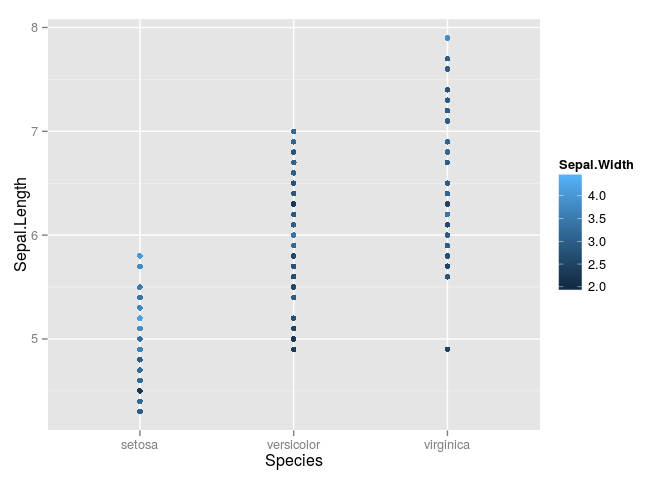
上の内容は離散的な変数の凡例ですが、連続的な変数の凡例(colourbar)ではできますか?
p <- ggplot(iris, aes(x = Species, y = Sepal.Length, colour = Sepal.Width)) +
  geom_point()
p
A3
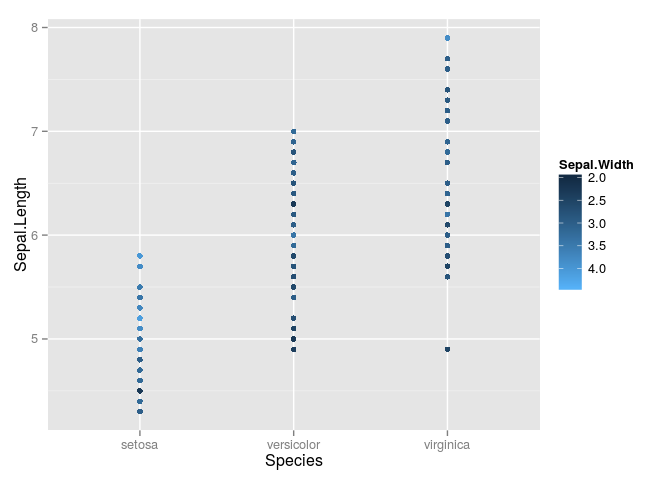
可能です。Q1のreverse = TRUEやQ2のorder = hogeのオプションはguide_colourbarも対応しています。まずreverseでの例はこちらです:
p <- ggplot(iris, aes(x = Species, y = Sepal.Length, colour = Sepal.Width)) +
  geom_point() +
  guides(colour = guide_colourbar(reverse = TRUE))
p
orderでの例はこちらです:
p <- ggplot(diamonds, aes(carat, price, colour = depth, shape = cut)) +
  geom_point() +
  theme(legend.position = "top") +
  guides(shape = guide_legend(order = 1),
         colour = guide_colourbar(order = 2))
p
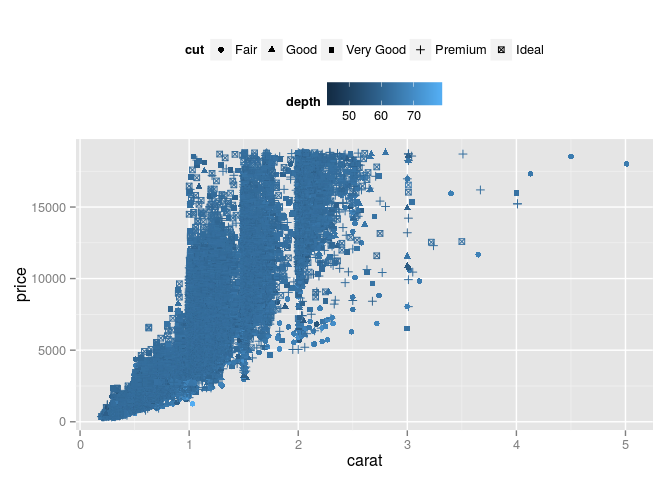
guidesをつけていないと、colourbarのdepthが優先されて上に来ますが、このコードのように設定すると下に来ます。