(2016/03/15追記)ggplot2 v2.1.0で動作確認しました。
Q
x軸を並べ替えたいのですが、どうすればいいのでしょうか。
A
変数が連続変数か離散変数かによってかなり違ってきます。
連続的である場合
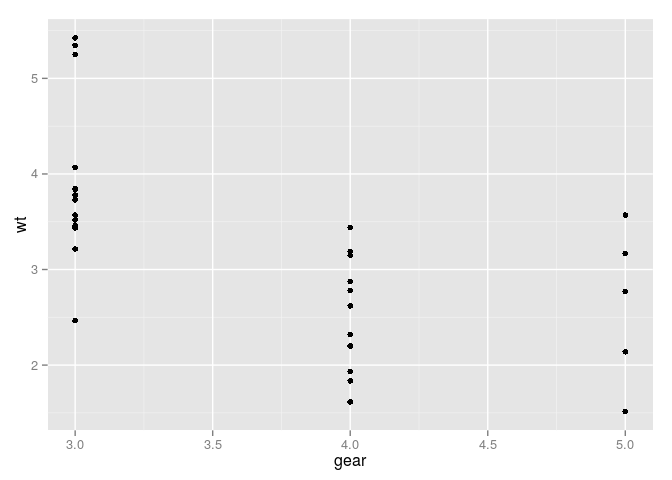
軸が連続的である場合、標準で昇順になるかと思います:
library(ggplot2)
p <- ggplot(mtcars, aes(x = gear, y = wt)) +
  geom_point()
p
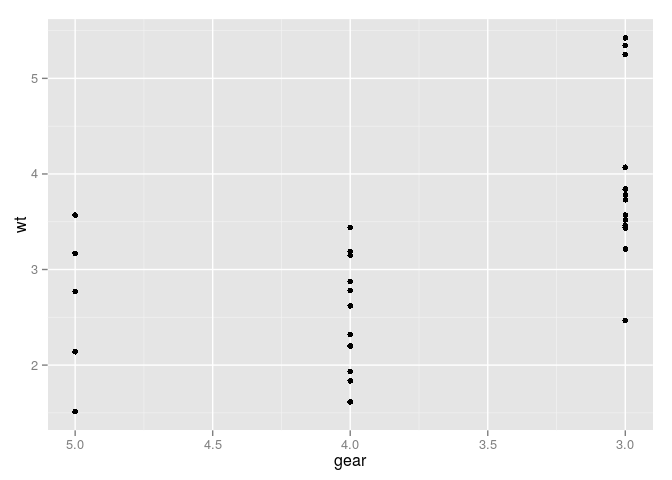
これを反転して降順にしたい場合は、+ scale_x_reverse()を追加します:
p <- ggplot(mtcars, aes(x = gear, y = wt)) +
  geom_point() +
  scale_x_reverse()
p
離散的である場合
多くの場合、factor型かと思います。
もとは数値データをas.factorで使っているパターン
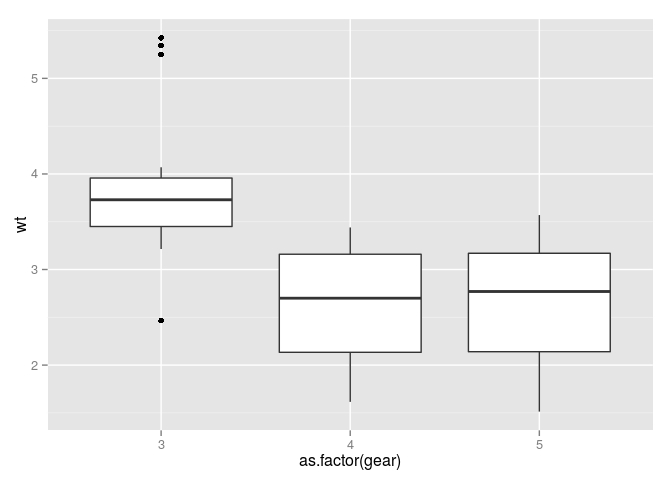
以下のようなパターンを考えます:
p <- ggplot(mtcars, aes(x = as.factor(gear), y = wt)) +
  geom_boxplot()
p
この場合、以下のような変数を新たに算出し、reorderに組み込みます:
mtcars.v2 <- transform(mtcars, gear2 = gear * -1) # 値の順序が逆転する変数gear2を作成
p <- ggplot(mtcars.v2, aes(x = reorder(gear, gear2), y = wt)) +
  geom_boxplot()
p
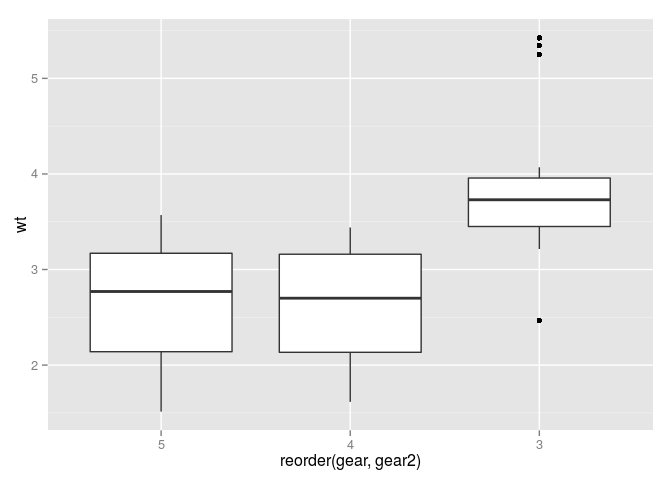
gear2は値が負になりますが、この変数はgearの順番をreorderさせるためだけに使用するので問題ありません。
何か外的な基準に基づいて並べ替えたいパターン
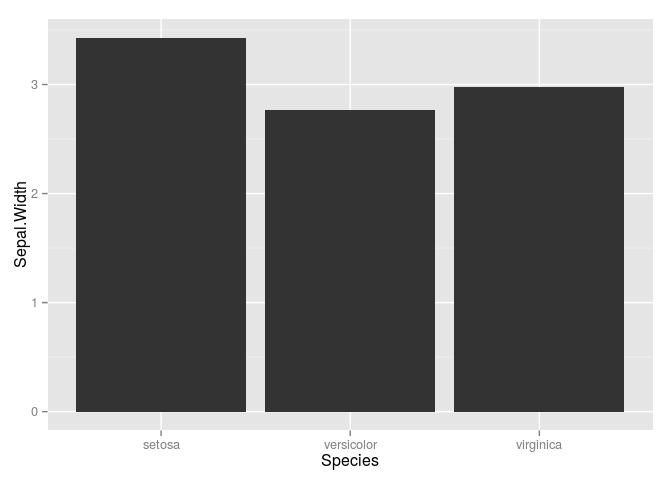
factor型の変数の順序を、他の変数の要約値(平均や中央値など)で並べ替えたい場合があります。以下を例にします:
ggplot(iris, aes(x = Species, y = Sepal.Width)) +
  stat_summary(fun.y = mean, geom = "bar")
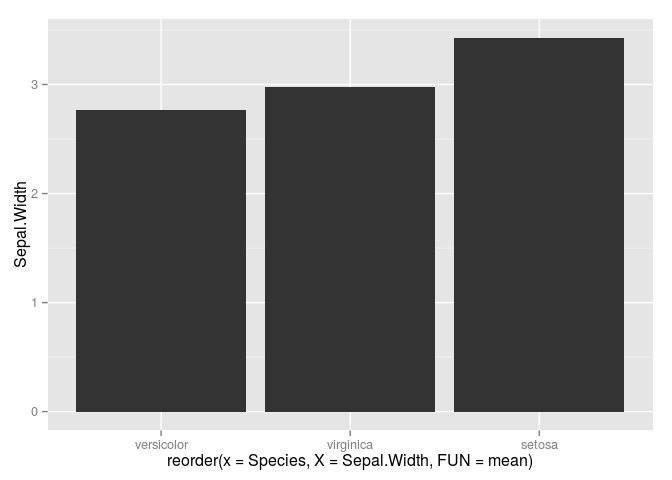
このx軸を、Sepal.Widthの昇順で並べ替えるには、以下のようにします:
ggplot(iris, aes(x = reorder(x = Species, X = Sepal.Width, FUN = mean), y = Sepal.Width)) +
  stat_summary(fun.y = mean, geom = "bar")
reorderの設定についてはこの変数のヘルプを確認してください。
順序的意味がないfactor型を任意に並べ替えたいパターン
※ 2015/8/2修正: ggplot2ではfactor型のorderは考慮しないそうですので、該当箇所を削除して修正しました(@kohskeさん@berobero11さんありがとうございました)
※ 大幅に改定することになったので、この箇所についてはほぼ書きなおしています。
ggplot2では、factor型のlevelsで表示される順番で項目を並べます:
levels(iris$Species)

[1] "setosa"     "versicolor" "virginica"
この順番は、factor(x, levels = c("hoge", ...))で変更可能です。したがって、この順序を新たに設定すればそのようになります:
iris2 <- transform(iris, Species= factor(Species, levels = c("virginica", "setosa", "versicolor")))
なお、この時全てのlevelsを含めるよう注意してください。
このirisとiris2を比較します:
ggplot(iris, aes(Species)) +
  geom_bar()

ggplot(iris2, aes(Species)) +
  geom_bar()
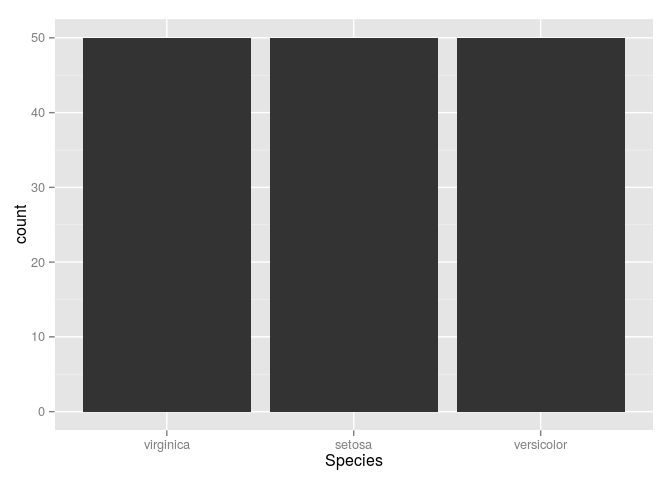
このように、factor型の場合は順序を設定することで、任意に並べ替えることが可能です。