続編 -> goroutineのgoは剛田武の剛だ。goroutineにみるジャイアニズムを検証する。
goroutineは終了しているものの、goroutineがGCされずにメモリがリークする状態が起きて困った。
- 大量のgoroutineが同時に存在するとGCできずにリークするみたい。
- 即座にgoroutineが終了(つまり同時に存在するgoroutineの数が多くない)する場合は、ちゃんとGCするみたい。
環境
OS: macOS 10.12.6
Go version: 1.8.3
サンプルコード
package main

import (
	"log"
	"net/http"
	_ "net/http/pprof"
	"runtime"
	"sync"
	"time"
	"runtime/debug"
)

func main() {
	test()
	runtime.GC()
	debug.FreeOSMemory()
	time.Sleep(3600 * time.Second)
}

var wghoge sync.WaitGroup

func test() {
	go func() {
		log.Println(http.ListenAndServe("localhost:6060", nil))
	}()
	log.Println("start")
	for i := 0; i < 10000; i++ {
		wghoge.Add(1)
		go routine3()
	}
	log.Println("num goroutine: ", runtime.NumGoroutine())
	wghoge.Wait()
	log.Println("done")
	log.Println("num goroutine: ", runtime.NumGoroutine())
}

func routine1() {
	wghoge.Done()
}

func routine2() {
	time.Sleep(time.Second)
	wghoge.Done()
}

func routine3() {
	_ = make([]byte, 10000)
	time.Sleep(time.Second)
	wghoge.Done()
}

func routine4() {
	hello := make([]byte, 1000)
	go subroutine4(hello)
	time.Sleep(time.Second)
	wghoge.Done()
}

func subroutine4(buf []byte) {
	buf[0] = 1
}
結果
routine1
$ go run main.go
2017/08/23 18:08:29 start
2017/08/23 18:08:29 num goroutine:  21
2017/08/23 18:08:29 done
2017/08/23 18:08:29 num goroutine:  4

2.3MB (これが正常)
routine2
$ go run main.go
2017/08/23 18:09:32 start
2017/08/23 18:09:32 num goroutine:  10003
2017/08/23 18:09:33 done
2017/08/23 18:09:33 num goroutine:  3

27.6MB (25.3MBリークしてる)
routine3
$ go run main.go
2017/08/23 18:10:32 start
2017/08/23 18:10:32 num goroutine:  10003
2017/08/23 18:10:33 done
2017/08/23 18:10:33 num goroutine:  3
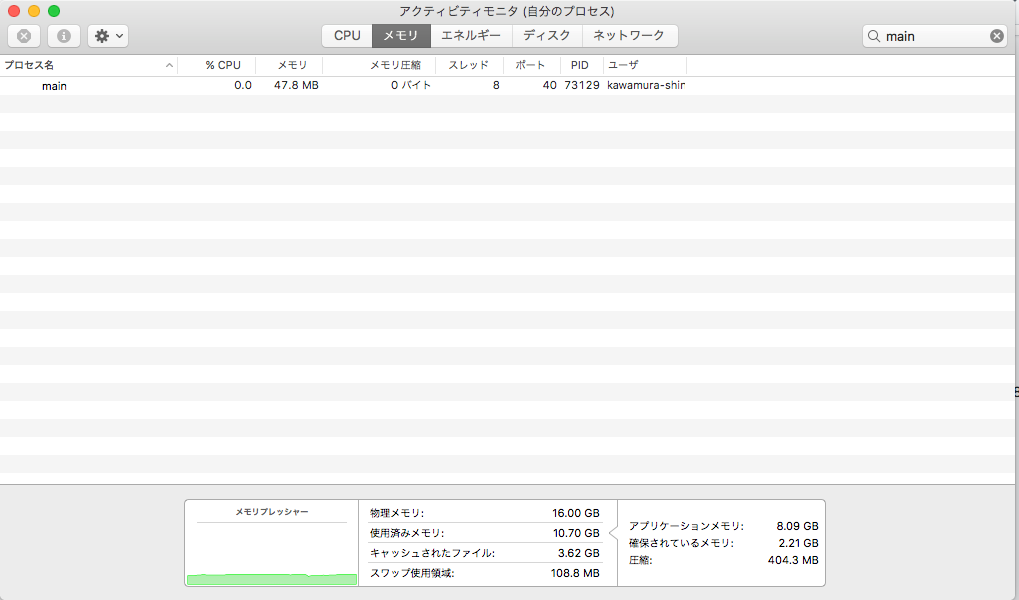
47.8MB (45.5MBリークしてる)
routine4
$ go run main.go
2017/08/23 18:27:53 start
2017/08/23 18:27:53 num goroutine:  10004
2017/08/23 18:27:54 done
2017/08/23 18:27:54 num goroutine:  3

29.1MB (26.8MBリークしてる)
ヒープとスタック
routine3
スタックにallocateされている
スタックにallocateされたものは、goroutineがGCされていないため余分にリークしている。(47MB)
$ go build -gcflags -m main.go
# command-line-arguments
./main.go:56: can inline subroutine4
./main.go:46: wghoge escapes to heap
./main.go:44: routine3 make([]byte, 1000) does not escape // <-ここ
./main.go:20: func literal escapes to heap
./main.go:20: func literal escapes to heap
./main.go:23: "start" escapes to heap
./main.go:25: wghoge escapes to heap
./main.go:28: "num goroutine: " escapes to heap
./main.go:28: runtime.NumGoroutine() escapes to heap
./main.go:29: wghoge escapes to heap
./main.go:30: "done" escapes to heap
./main.go:31: "num goroutine: " escapes to heap
./main.go:31: runtime.NumGoroutine() escapes to heap
./main.go:21: http.ListenAndServe("localhost:6060", nil) escapes to heap
./main.go:23: test ... argument does not escape
./main.go:28: test ... argument does not escape
./main.go:30: test ... argument does not escape
./main.go:31: test ... argument does not escape
./main.go:21: test.func1 ... argument does not escape
./main.go:35: wghoge escapes to heap
./main.go:40: wghoge escapes to heap
./main.go:56: subroutine4 buf does not escape
./main.go:50: make([]byte, 1000) escapes to heap
./main.go:53: wghoge escapes to heap
routine4
[]byteはヒープにallocateされている。
ヒープは正しくGCされている。(29MB)
$ go build -gcflags -m main.go
# command-line-arguments
./main.go:56: can inline subroutine4
./main.go:56: subroutine4 buf does not escape
./main.go:50: make([]byte, 1000) escapes to heap // <- ここ
./main.go:53: wghoge escapes to heap
./main.go:20: func literal escapes to heap
./main.go:20: func literal escapes to heap
./main.go:23: "start" escapes to heap
./main.go:25: wghoge escapes to heap
./main.go:28: "num goroutine: " escapes to heap
./main.go:28: runtime.NumGoroutine() escapes to heap
./main.go:29: wghoge escapes to heap
./main.go:30: "done" escapes to heap
./main.go:31: "num goroutine: " escapes to heap
./main.go:31: runtime.NumGoroutine() escapes to heap
./main.go:21: http.ListenAndServe("localhost:6060", nil) escapes to heap
./main.go:23: test ... argument does not escape
./main.go:28: test ... argument does not escape
./main.go:30: test ... argument does not escape
./main.go:31: test ... argument does not escape
./main.go:21: test.func1 ... argument does not escape
./main.go:35: wghoge escapes to heap
./main.go:40: wghoge escapes to heap
./main.go:46: wghoge escapes to heap
./main.go:44: routine3 make([]byte, 1000) does not escape
結論
困った。
多分わかった。
routine2で
func main() {
	test()
	test()
	test()
	test()
	runtime.GC()
	debug.FreeOSMemory()
	time.Sleep(3600 * time.Second)
}
とすると、

で 29.3MBから変わらなくなった。
おそらく、goroutineはプールに溜められて再利用するような構造になっていて、同時実行数が増えるとプールのサイズが増えて戻らなくなるみたい。(要出典) プールされるのはgoroutineではなく、Heapメモリ。
routine3 でやると同様に、49.1MBで変わらなくなった。せめてスタックにあるメモリとかも解放されないみたいだ。
runtime.MemStats を見てみる。
routine3 で
http://localhost:6060/debug/pprof/heap?debug=1
にアクセスして、最後の部分を見てみる。
# runtime.MemStats
# Alloc = 5096360
# TotalAlloc = 8603416
# Sys = 54966520
# Lookups = 5
# Mallocs = 56624
# Frees = 41047
# HeapAlloc = 5096360
# HeapSys = 49807360
# HeapIdle = 44023808
# HeapInuse = 5783552
# HeapReleased = 44023808
# HeapObjects = 15577
# Stack = 524288 / 524288
# MSpan = 170392 / 327680
# MCache = 4800 / 16384
# BuckHashSys = 1443448
# GCSys = 1912832
# OtherSys = 934528
# NextGC = 9948944
# PauseNs = [130067 67694 123189 1952067 1685557 0 0 0 0 0 0 0 0 0 0 0 0 0 0 0 0 0 0 0 0 0 0 0 0 0 0 0 0 0 0 0 0 0 0 0 0 0 0 0 0 0 0 0 0 0 0 0 0 0 0 0 0 0 0 0 0 0 0 0 0 0 0 0 0 0 0 0 0 0 0 0 0 0 0 0 0 0 0 0 0 0 0 0 0 0 0 0 0 0 0 0 0 0 0 0 0 0 0 0 0 0 0 0 0 0 0 0 0 0 0 0 0 0 0 0 0 0 0 0 0 0 0 0 0 0 0 0 0 0 0 0 0 0 0 0 0 0 0 0 0 0 0 0 0 0 0 0 0 0 0 0 0 0 0 0 0 0 0 0 0 0 0 0 0 0 0 0 0 0 0 0 0 0 0 0 0 0 0 0 0 0 0 0 0 0 0 0 0 0 0 0 0 0 0 0 0 0 0 0 0 0 0 0 0 0 0 0 0 0 0 0 0 0 0 0 0 0 0 0 0 0 0 0 0 0 0 0 0 0 0 0 0 0 0 0 0 0 0 0 0 0 0 0 0 0 0 0 0 0 0 0]
# NumGC = 5
# DebugGC = false
Alloc = 5096360
HeapSys = 49807360
HeapIdle = 44023808
であるから、実際に使っているのは、5MBほど。
HeapIdle がほとんどを占めている。
つまり、Heapとしてプロセスが掴んでいるがOSに解放していないためにメモリリークが起きる。
runtime: GC: heap idle is not released / decreaseによると
- HeapIdleは、HeapReleasedを含む。
- Goは、OSに対して使わなくなったメモリを通知するが、そのメモリを実際に解放するかはOSが決める。OSが無視することもある。
- 実際にメモリがOSに回収されたかは、Goからは知るすべがないとのこと。
解決策
一度Heapしたものは解放されずに再利用されるみたいだ。
メモリがOSに回収されるかはOS次第であるみたい。
瞬間最大メモリ量を減らすことでメモリ量を制限できる。
あまりgoroutine関係ない。Goのメモリの扱い方の問題。