LoginSignup
0
0

More than 1 year has passed since last update.

数学_45

Posted at

考察

分布グラフを書いて推察する。
手作業・・

グラフで解決

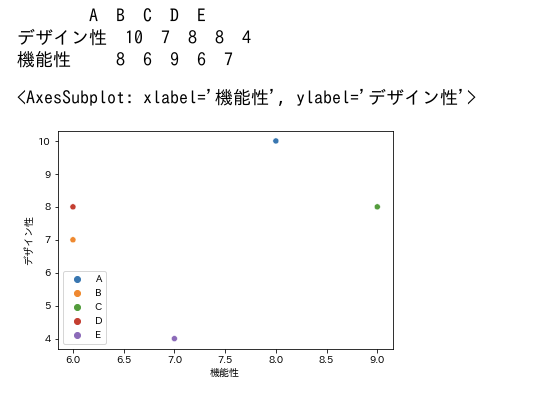
# グラフを描いて判断する(snsのsncatter Plot)
od = OrderedDict()
od['A'] = [10, 8]
od['B'] = [7, 6]
od['C'] = [8, 9]
od['D'] = [8, 6]
od['E'] = [4, 7]

df = pd.DataFrame.from_dict(od, orient='index',columns=['デザイン性','機能性'])
print(df.T)

sns.scatterplot(y='デザイン性',x='機能性',data=df,hue=df.index)

Screenshot from 2023-01-09 19-29-01.png

0
0
0

Register as a new user and use Qiita more conveniently

  1. You get articles that match your needs
  2. You can efficiently read back useful information
  3. You can use dark theme
What you can do with signing up
0
0