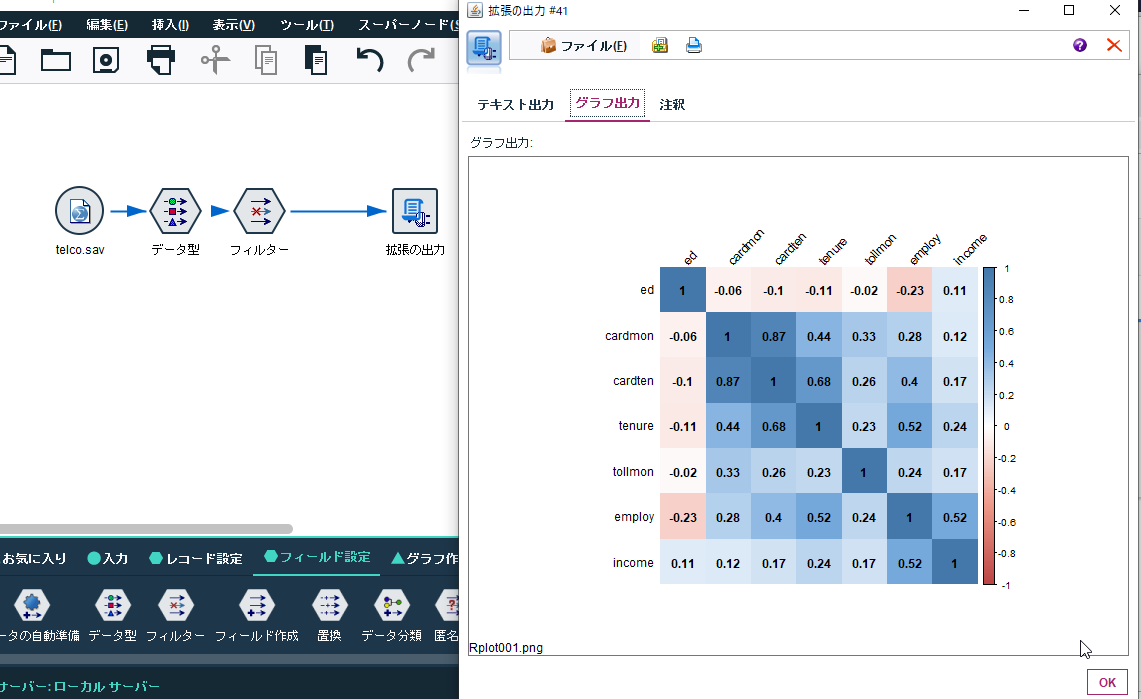
SPSS ModelerでR連携機能をつかって相関行列のヒートマップを作ってみます。
■テスト環境
Modeler 18.2.1
R 3.3.3
1 事前準備
R連携を行うためにはEssentials for RとR3.3の導入が必要です。
IBM® SPSS® Modeler - Essentials for R: インストール手順
https://www.ibm.com/support/knowledgecenter/ja/SS3RA7_18.2.1/modeler_r_plugin_install_project_ddita/clementine/programmability_option/r_essentials_install_instructions_container.html
2 拡張の出力ノードのシンタックス設定
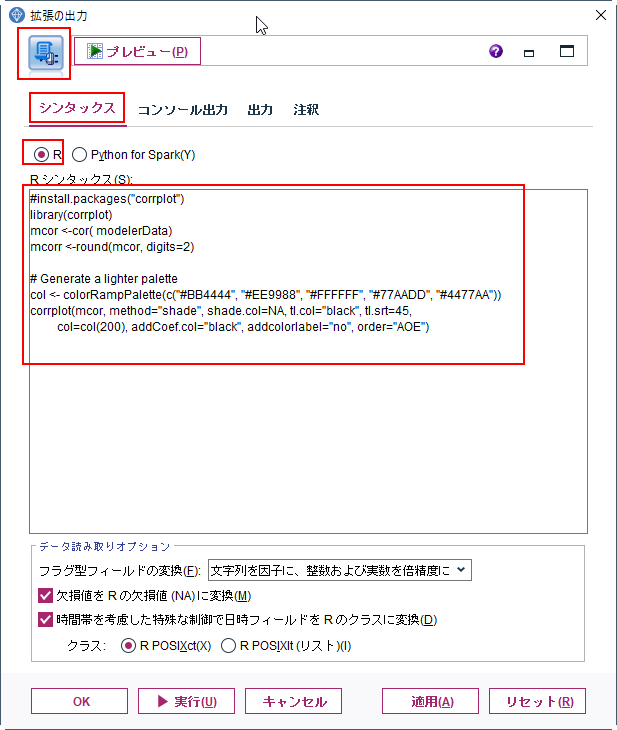
拡張の出力ノードにRのシンタックスを入力します。
# install.packages("corrplot")
library(corrplot)
mcor <-cor( modelerData)
mcorr <-round(mcor, digits=2)

# Generate a lighter palette
col <- colorRampPalette(c("#BB4444", "#EE9988", "#FFFFFF", "#77AADD", "#4477AA"))
corrplot(mcor, method="shade", shade.col=NA, tl.col="black", tl.srt=45,
         col=col(200), addCoef.col="black", addcolorlabel="no", order="AOE")
上の
Rのソースコードは以下を参照させてもらいました。
https://rpubs.com/yoshio/95789
初回の実行時は”#install.packages("corrplot")”のコメントをはずしてパッケージを導入してください。
3 結果
サンプルのストリームは以下です。
https://github.com/hkwd/spsssmodelercorrplot

