はじめに
Python の紹介に入っていきますが、まずは Python の機械学習でよく使用されるライブラリを身近なものに例えてみます。
紹介する例えは、私が主観的に思う身近なものに例えています。厳密には異なる部分がありますので、ご注意ください。
また、今回のコードの紹介は、インポートと簡単な使用例に留めます。
各ライブラリの詳細については、別途記事にする予定ですので、お待ちいただけますと幸いです。
本記事の対象となる方
- プログラミング初心者
- 機械学習・DeepLearningといったAI実装を学習しはじめた方
- numpy, pandas, matplotlib, seaborn, scikit-learnをこれから使用する方
環境
- Google Colabratory (以下、Colab)
ライブラリのインポートについて
これから紹介するライブラリは、インポートしてから使用可能になります。
import <ライブラリ名> as <略語>
このようにして、インポートは行います。
as <略語> の箇所は、インポート後にそのライブラリを短い名称で呼び出すためにつけます。
普段使いしている略語にも、ボールペン・食パン・教科書などがあります。
正式名称は、ボールポイントペン・主食用パン・教科用図書です。誰もこんな呼び方していないですよね。
ライブラリも同じで、よく使うものは略語を設定して使っているという感覚を持ってもらえると大丈夫です。
Colabは、各ライブラリのインストール済みの環境になるので、インストールについては説明していません。
ローカル環境や仮想環境で実行する際は、事前にインストールしてからインポートを行わないとインポートエラーとなりますので、ご注意ください。
Numpy
Numpy は 数値計算 を行うライブラリです。
例えると、**行列計算が可能な関数電卓**のようなものです。
# numpyのインポート
import numpy as np

# numpy のバージョン
np.__version__
1.19.5
# x, y という配列を作成
x = np.array([1, 1])
y = np.random.rand(2, 2)

# x, y の掛け算
z = np.dot(x, y)

# x, y, z の表示
print(f'x = {x}')
print(f'y = {y}')
print(f'z = {z}')

# 実行結果
x = [1 1]
y = [[0.17101494 0.69612195]
 [0.7879925  0.60866322]]
z = [0.95900745 1.30478517]
Pandas
Pandas は データフレーム という構造を使い データの解析 を行うライブラリです。
例えると、**Excel のシート** のようなものです。
# pandasのインポート
import pandas as pd

# pandas のバージョン
pd.__version__
1.1.5
# df というデータフレームを作成
df = pd.DataFrame(np.random.randn(4, 4), index=["1行", "2行", "3行", "4行"], columns=["1列", "2列", "3列", "4列"])

# df の表示
df

# 実行結果
		1列		2列		3列		4列
1行	0.453633	-0.730396	-1.200269	0.217617
2行	1.538881	0.213172	1.007157	-1.410174
3行	-1.020639	-0.474193	1.134175	-0.583397
4行	-0.345173	-0.007356	-0.778200	-0.738700
Matplotlib
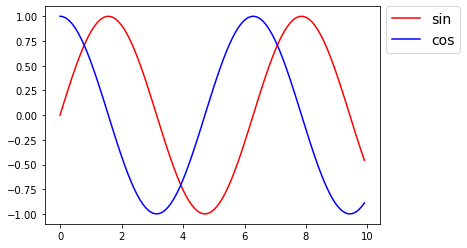
Matplotlib は グラフの描画など データ可視化 のためのライブラリです。
例えると、**Excel のグラフ** のようなものです。
# matplotlibのインポート
import matplotlib

# matplotlib のバージョン
matplotlib.__version__
3.2.2
- matplotlib の中にある、pyplot が図形の描画を行う機能をもつので、別途インポートします。
# matplotlib.pyplot のインポート
import matplotlib.pyplot as plt
# 横軸(x軸):x = 0 ~ 10 まで 0.1 区切り
x = np.arange(0, 10, 0.1)

# 縦軸(y軸):s = sin(x)
s = np.sin(x)

# 縦軸(y軸):c = cos(x)
c = np.cos(x)

# x軸, y軸 を設定
plt.plot(x, s, "r", label="sin")
plt.plot(x, c, "b", label="cos")

# 凡例の表示
plt.legend(bbox_to_anchor=(1.02, 1), loc='upper left', borderaxespad=0, fontsize=14)

# グラフの描画
plt.show()
- 実行結果
Seaborn
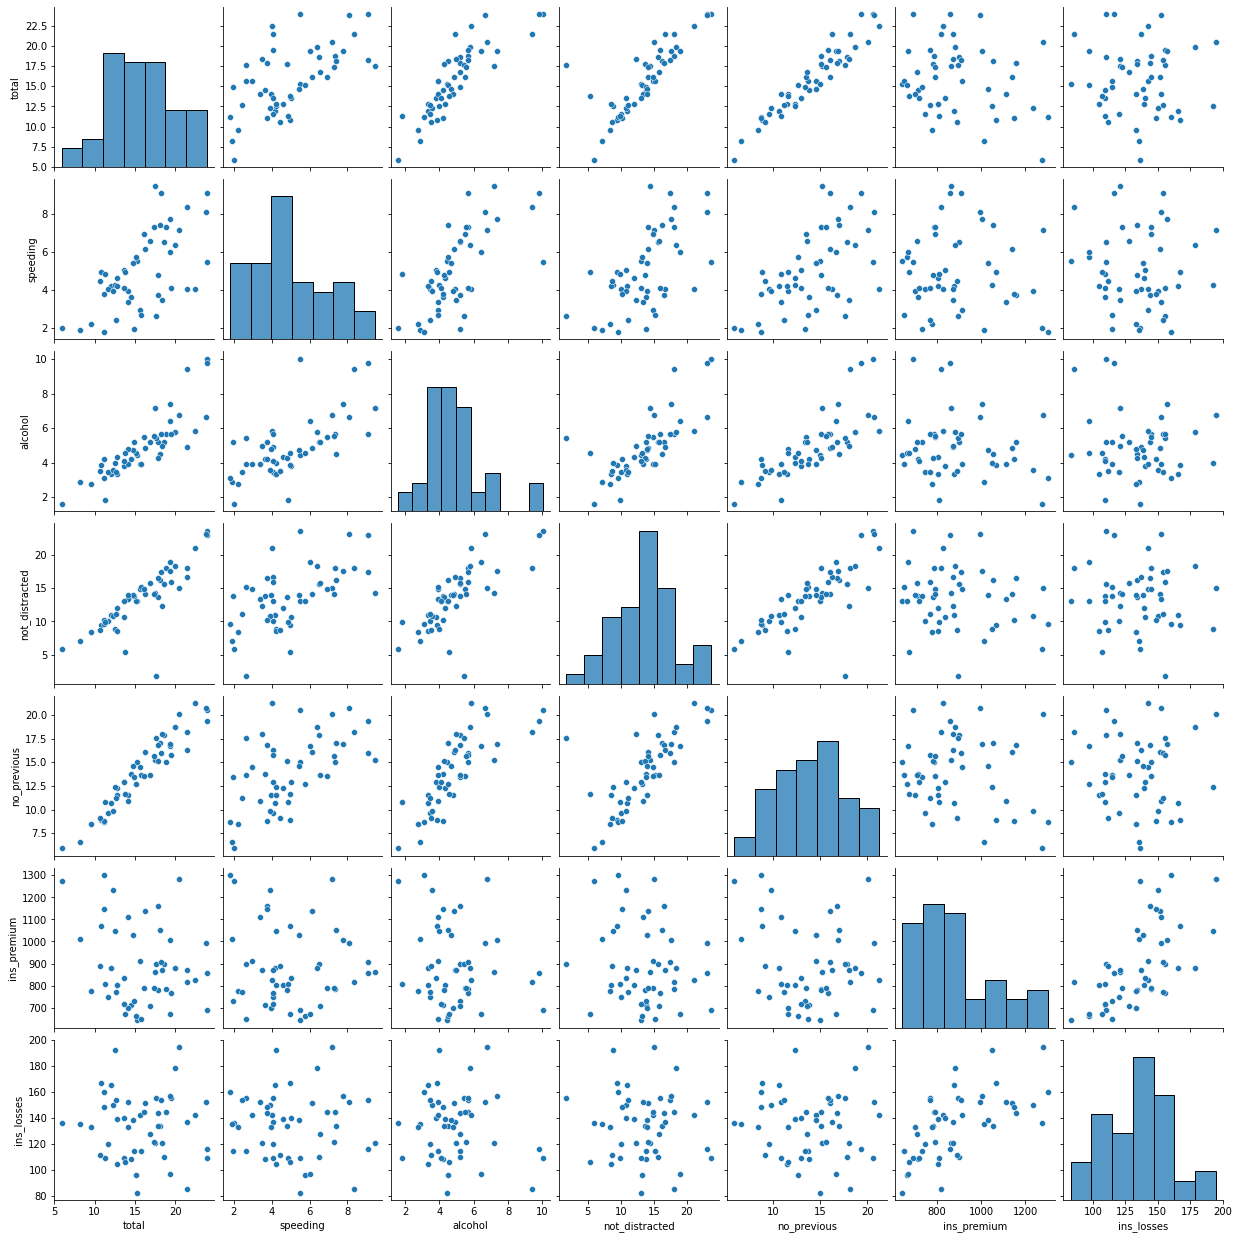
Seaborn は Matplotlib と同様に、データ可視化 のためのライブラリです。
散布図やヒストグラムの表示によく使用されます。
# seabornのインポート
import seaborn as sns

# seaborn のバージョン
sns.__version__
0.11.2
# data にcar_crashesのデータを取り込む
data = sns.load_dataset("car_crashes")

# グラフの描画
sns.pairplot(data)
- 実行結果
Scikit-learn
Scikit-learn は 機械学習アルゴリズムと、サンプルデータセットが用意されている 機械学習 のためのライブラリです。
例えると、**機械学習における工具箱** のようなものです。
# scikit-learnのdatasetsからload_bostonをインポート
from sklearn.datasets import load_boston

# datasetにload_bostonのデータを格納
dataset = load_boston()

# x, tにdatasetのdata, targetを格納
x = dataset.data
t = dataset.target

# pandasのデータフレームにx, tを格納 (見やすくするため)
df_x = pd.DataFrame(x, columns=dataset.feature_names)
df_t = pd.DataFrame(t)
# df_xの表示
df_x

# 実行結果
CRIM	ZN	INDUS	CHAS	NOX	RM	AGE	DIS	RAD	TAX	PTRATIO	B	LSTAT
0	0.00632	18.0	2.31	0.0	0.538	6.575	65.2	4.0900	1.0	296.0	15.3	396.90	4.98
1	0.02731	0.0	7.07	0.0	0.469	6.421	78.9	4.9671	2.0	242.0	17.8	396.90	9.14
2	0.02729	0.0	7.07	0.0	0.469	7.185	61.1	4.9671	2.0	242.0	17.8	392.83	4.03
3	0.03237	0.0	2.18	0.0	0.458	6.998	45.8	6.0622	3.0	222.0	18.7	394.63	2.94
4	0.06905	0.0	2.18	0.0	0.458	7.147	54.2	6.0622	3.0	222.0	18.7	396.90	5.33
...	...	...	...	...	...	...	...	...	...	...	...	...	...
501	0.06263	0.0	11.93	0.0	0.573	6.593	69.1	2.4786	1.0	273.0	21.0	391.99	9.67
502	0.04527	0.0	11.93	0.0	0.573	6.120	76.7	2.2875	1.0	273.0	21.0	396.90	9.08
503	0.06076	0.0	11.93	0.0	0.573	6.976	91.0	2.1675	1.0	273.0	21.0	396.90	5.64
504	0.10959	0.0	11.93	0.0	0.573	6.794	89.3	2.3889	1.0	273.0	21.0	393.45	6.48
505	0.04741	0.0	11.93	0.0	0.573	6.030	80.8	2.5050	1.0	273.0	21.0	396.90	7.88
506 rows × 13 columns

# df_yの表示
df_y

# 実行結果
	0
0	24.0
1	21.6
2	34.7
3	33.4
4	36.2
...	...
501	22.4
502	20.6
503	23.9
504	22.0
505	11.9
506 rows × 1 columns
さいごに
ここまで読んでいただき誠にありがとうございます。
今回は Python のライブラリについて簡単に紹介してみました。
次回は Python の型について説明したいと思います。