ggplot2なら簡単だが、baseのplotだと思っていたより難しかった。
r2.R
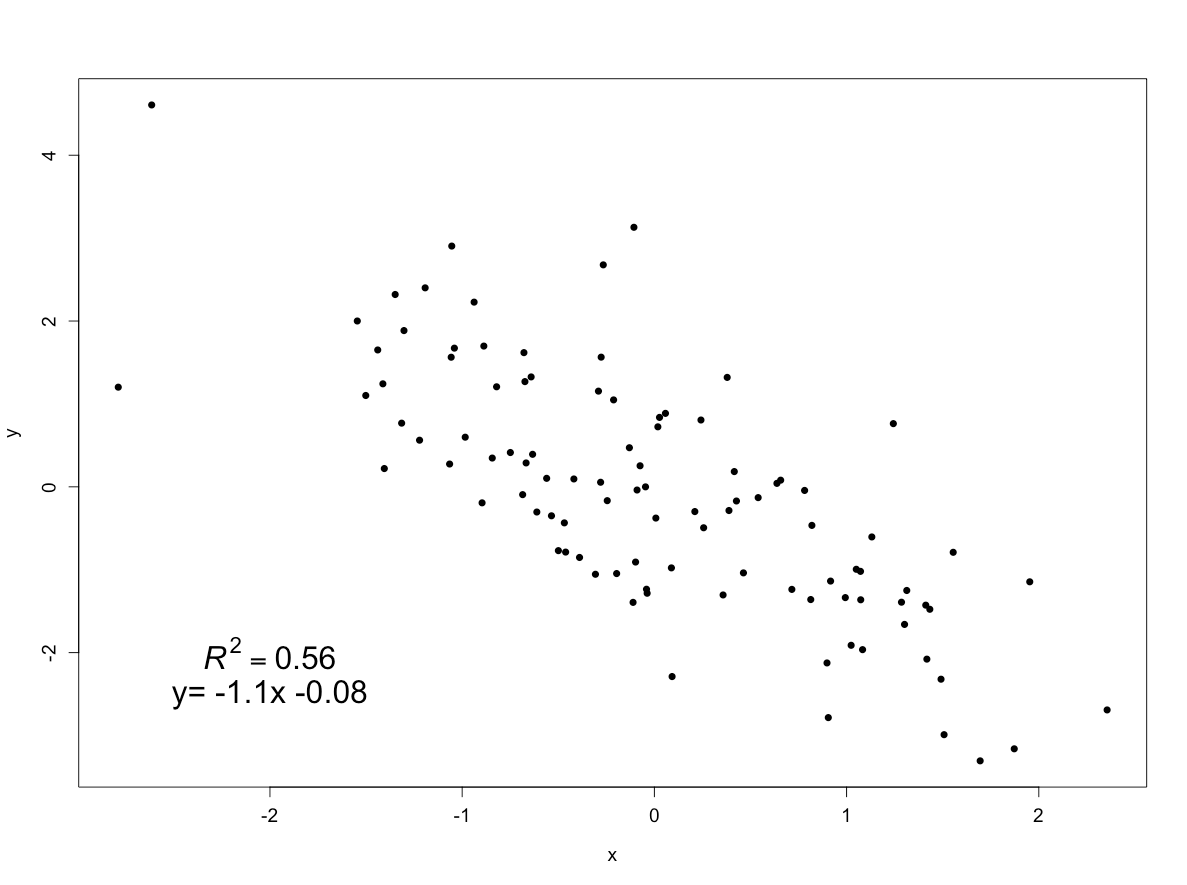
xx1 <- rnorm(100)
yy1 <- -1*xx1+rnorm(100)
result <- lm(yy1~xx1)
slp <- round(result$coef[2], digits=2)
intc <- round(result$coef[1], digits=2)
plot(xx1,yy1,xlab="x",ylab="y",
     cex.axis = 1.2, cex.lab = 1.2, bty = "o", pch=16, col = "black", lwd=1.5)
text(x=-2, y=-2, as.expression(substitute(italic(R)^2 == r, list(r = round(summary(result)$r.sq, digits=2)))), cex=2)
if (intc > 0) {text(x=-2, y=-2.5, as.expression(paste0("y= ", slp, "x + ", intc)), cex=2) # y切片の符号で場合分け
  } else {text(x=-2, y=-2.5, as.expression(paste0("y= ", slp, "x ", intc)), cex=2)}
結果はこんな感じ。