Rのggplot2パッケージは、デフォルトではグラフの目盛りは外向きになっていますが、向きと長さを変えることができます。この記事では、その方法を示します。
irisのグラフを使って、普通にグラフを描くと次のようになります。
plotiris.R
ggp <- ggplot(data=iris) +
  geom_point(aes(x=Sepal.Length, y=Petal.Length))
print(ggp)
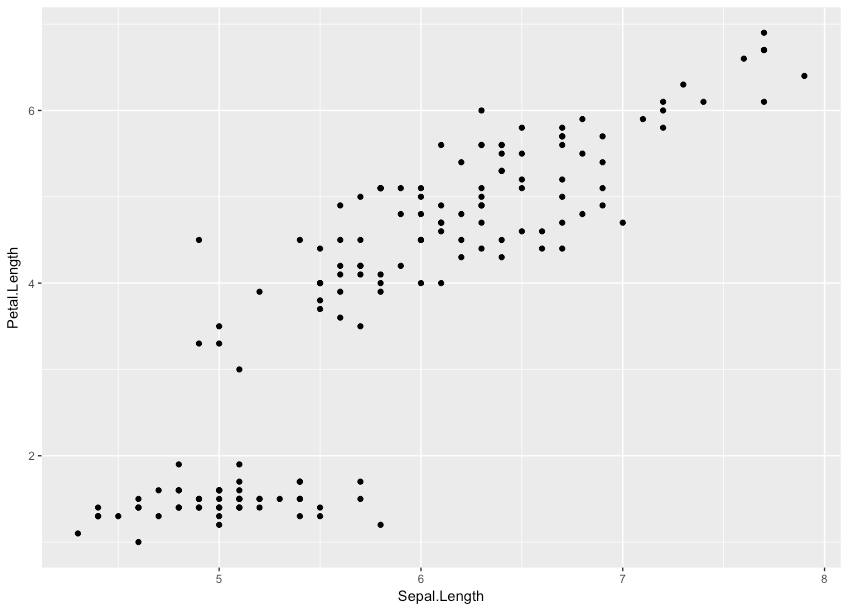
グラフの目盛りは外側を向いています。
theme()を次のようにいじってやると、
plotiris2.R
ggp <- ggplot(data=iris) +
  geom_point(aes(x=Sepal.Length, y=Petal.Length)) +
  theme(
    axis.ticks = element_line(colour = "black"),
    axis.ticks.length = unit(-3, "mm"),
    axis.text.x = element_text(margin = unit(rep(8,4), "mm")),
    axis.text.y = element_text(margin = unit(rep(8,4), "mm"))
  )
print(ggp)

目盛りは内向きになりました。
axis.ticks.length の数字をマイナスにすればいいです。ただし、その場合axis.text.x=~で目盛りと数字の距離を調整しないと適切な位置に目盛りの数字が表示されません。
僕はどっちかというと内向きのほうが好きです。