マウスをグラフプロットに重ねたとき、波形グラフの表示と、音の再生を行う。
音響の解析をしていたとき、音響信号から抽出された2次元量を2次元グラフ上にプロットしていました。
マウスをプロット上に重ねたときに、波形グラフと、音の再生ができたらデータの可視化・可聴化ができてデータの理解がすすむと思いサンプルコードを作成した。
環境 windows10 anaconda python3.8 bokeh3.2.1
検証 ubuntu22.04 python 3.10 bokeh 3.3.2
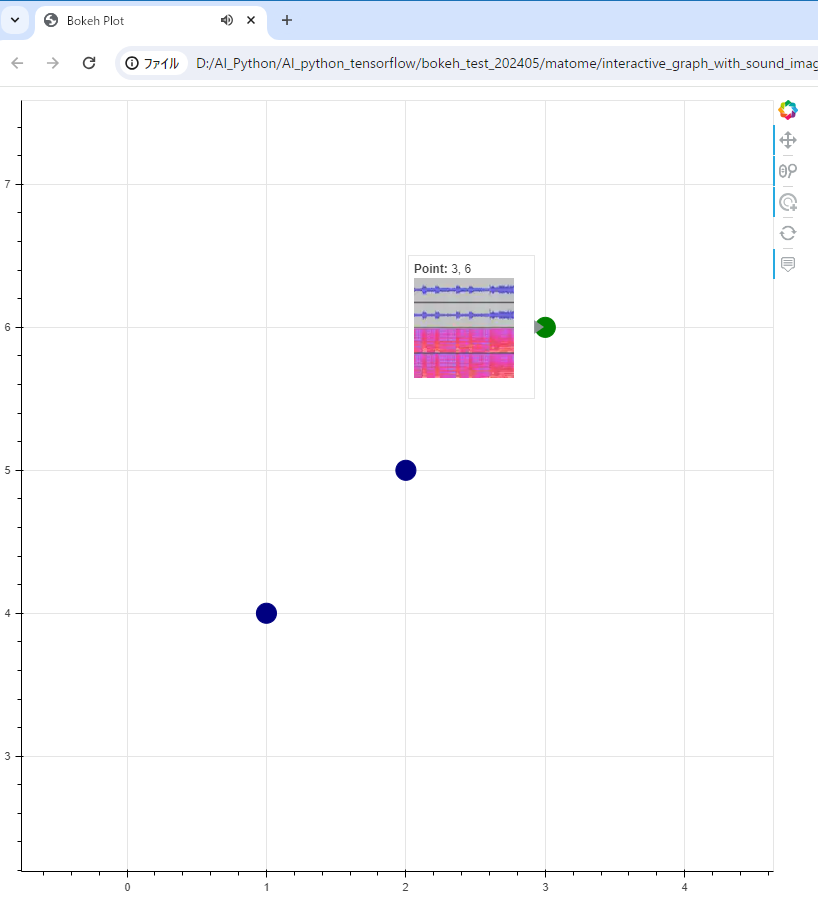
出力htmlのサンプル
マウスをプロットに重ねると、波形画像を表示。
クリックすると、プロットの色が変わりwavファイルを再生。

スケールの縮尺や表示領域の移動はbokehのツール tools="tap,pan, wheel_zoom, reset"で設定。
ソースコード
サンプルのhtmlファイルはこちらにあるので、DLして動作を試せます。htmlには画像と音が埋め込まれています。html不安な人はソースコード見て自分で作成(実行するだけ)してね。
https://github.com/katakaku/View_sound_and_wave
wavでもmp3でも作成できます(検索して置換するだけ)。mp3の方が埋め込みのhtmlのファイル容量が小さいです。画像・音源データは各自用意するかgithubのサンプルを使用してください。
bokeh2系ではplot_width だった記法がbokeh3系ではwidthに変わっているようです。
from bokeh.plotting import figure, show, output_file
from bokeh.models import ColumnDataSource, CustomJS, TapTool, Circle, HoverTool
import base64
from PIL import Image
from io import BytesIO

def encode_image(file_path, format='WEBP', size=(224, 224), quality=75):
    # 画像を開く
    img = Image.open(file_path)
    # リサイズ
    img = img.resize(size, Image.LANCZOS)
    # BytesIOを使用してメモリ上に保存
    buffer = BytesIO()
    img.save(buffer, format=format, quality=quality)
    return base64.b64encode(buffer.getvalue()).decode("utf-8")

def encode_audio(file_path):
    # 音声ファイルを開く
    with open(file_path, "rb") as file:
        return base64.b64encode(file.read()).decode("utf-8")

# 音声データと画像データをBase64でエンコード
audio_files = ["test1.wav", "test2.wav", "test3.wav"]
image_files = ["test1.png", "test2.png", "test3.png"]
encoded_audios = [encode_audio(f"./{f}") for f in audio_files]
encoded_images = [encode_image(f"./{f}", format='WEBP', size=(124, 124), quality=30) for f in image_files]

# Bokehのプロットを設定 plot_widthはbokeh2の形式
p = figure(width=800, height=800, tools="tap,pan, wheel_zoom, reset")

# データソースの設定
source = ColumnDataSource(data={
    'x': [1, 2, 3],
    'y': [4, 5, 6],
    'audio': encoded_audios,
    'image': encoded_images  # 画像データを追加
})

# サークルの描画設定
circle_renderer = p.circle('x', 'y', size=20, source=source, color='navy', selection_color='green')

# 選択されていない時のスタイルを明示的に設定
nonselection_circle = Circle(fill_color='navy', line_color='navy')
circle_renderer.nonselection_glyph = nonselection_circle

# CustomJSを使って音声を再生するコード
code = """
    var indices = source.selected.indices;
    if (indices.length > 0) {
        var audio_src = source.data['audio'][indices[0]];
        if (window.audio_player) {
            window.audio_player.pause();  // 前の音声を停止
        }
        window.audio_player = new Audio("data:audio/wav;base64," + audio_src);
        window.audio_player.play();  // 新しい音声を再生
    }
"""
taptool = p.select(type=TapTool)
taptool.callback = CustomJS(args=dict(source=source), code=code)

# HoverToolの設定で画像サムネイルを表示
hover = HoverTool(tooltips="""
    <div>
        <div><strong>Point:</strong> @x, @y</div>
        <div><img src="data:image/webp;base64,@image" width="100" height="100" style="float: left; margin: 0 15px 15px 0;" alt="Image not available"></div>
    </div>
""")
p.add_tools(hover)

output_file("interactive_graph_with_sound_images.html")
show(p)
発展
今回は、音源データと波形画像をあらかじめ与えていますが、音源データからプログラムで波形とスペクトログラムの画像を作ってもいいです。
UMAPやt-SNEで高次元から2次元空間に圧縮したデータに適用するとおもしろそうです。
bokehへのプロットデータはpandasで渡すと良いようです。