結論
同じ個体の行動圏利用の変化を調べるなら Bhattacharyya’s affinity (BA)、
個体間の行動圏重複を調べるなら Utilization distribution overlap index (UDOI)がよいかも。
行動圏の重複を計算する方法
adehabitat から adehabitatHR へ乗り換えようという記事を書いた。
せっかくなので行動圏の重複を計算する。
ひとくちに重複といっても計算方法は数種類ある。
Fieberg & Kochanny [2005] で親切に解説されている。
※丁寧に読む時間ができたらこの記事に追記するかも。
directional measure
以下の2つの方法では個体 i を主体に計算したインデックスと個体 j を主体に計算したインデックスが異なる値になる(計算する"方向"で値が異なる)。
Percent overlap (method="HR")
HR_{i,j}=A_{i,j}/A_i
いちばんシンプルな計算方法。
個体 i と個体 j のそれぞれの行動圏にしめる重複域の面積割合を求める。
Probability overlap (method="PHR")
PHR_{i,j}=\iint_{A_i} UD_j(x,y)dxdy
(あまり使わないような気がする)
個体 i が個体 j の行動圏内に位置する確率を求める(逆も同様)。
percent overlap では面積割合を求めたが、この方法では利用頻度も考慮する。
non-directional measure
1つのインデックスのほうが理解しやすそう、ということで以下の 3 つの方法がある。
方法によって計算式は異なるが、どの方法も個体 i と個体 j が独立に(互いに影響を受けずに)移動するという想定のもと、
2 個体の utilization distribution がどれくらい似ているかを計算する。
Volume of intersection index (method="VI")
VI=\int_x \!\int_y min(UD_i(x,y),UD_j(x,y)) dxdy
一切重複しないときは 0, utilization distribution が完全に一致するとき 1 となる。
BA や UDOI のほうがよい [Fieberg & Kochanny, 2005]、BA の結果とよく相関する [Kochanny et al., 2008] ため、あまり使われない?
Bhattacharyya’s affinity (method="BA")
BA=\int_x \!\int_y \sqrt{UD_i(x,y)} \times \sqrt{UD_j(x,y)} dxdy
一切重複しないときは 0, utilization distribution が完全に一致するとき 1 となる。
utilization distribution 全体の類似度を調べるのに適している [Fieberg & Kochanny, 2005]。
(e.g., 行動圏の年変動などを調べる)
Utilization distribution overlap index (method="UDOI")
UDOI=A_{i,j}\int_x \!\int_y UD_i(x,y) \times UD_j(x,y) dxdy
一切重複しないときは 0, 完全に重複していて utilization distribution も完全一致する場合は 1 になる。
utilization distribution は一致しないが面積の重複が非常に高いとき、値が 1 以上になることがあるらしい。
2個体の重複域利用を調べるのに最適 [Fieberg & Kochanny, 2005]。
(e.g., 個体間が出会う頻度を考察する)
実際に行動圏の重複を評価する
いろいろ説明したが adehabitatHR パッケージの kerneloverlaphr 関数で method を指定すれば全部計算してくれる
library(adehabitatHR)
# 1-2列目にxy座標、3列目に個体IDが入ったファイルを読み込む
d<-read.csv(適切なファイル)
# データを準備する
d_sp<-SpatialPoints(d[,c(1:2)], proj4string=CRS("+init=epsg:32652"))
d_sp<-data.frame(d_sp)
idd_sp<-data.frame(d[3])
coordinates(idd_sp)<-d_sp
# カーネル推定する
ud<-kernelUD(idd_sp[,1],h ="href",grid=50,same4all=TRUE,hlim = c(0.1, 1.5),kern="bivnorm",extent=0.5)
# ID間の重複具合を計算する。例は UDOI。
kerneloverlaphr(ud, method="UDOI", conditional=TRUE)
ためしに計算した結果は以下のとおり。
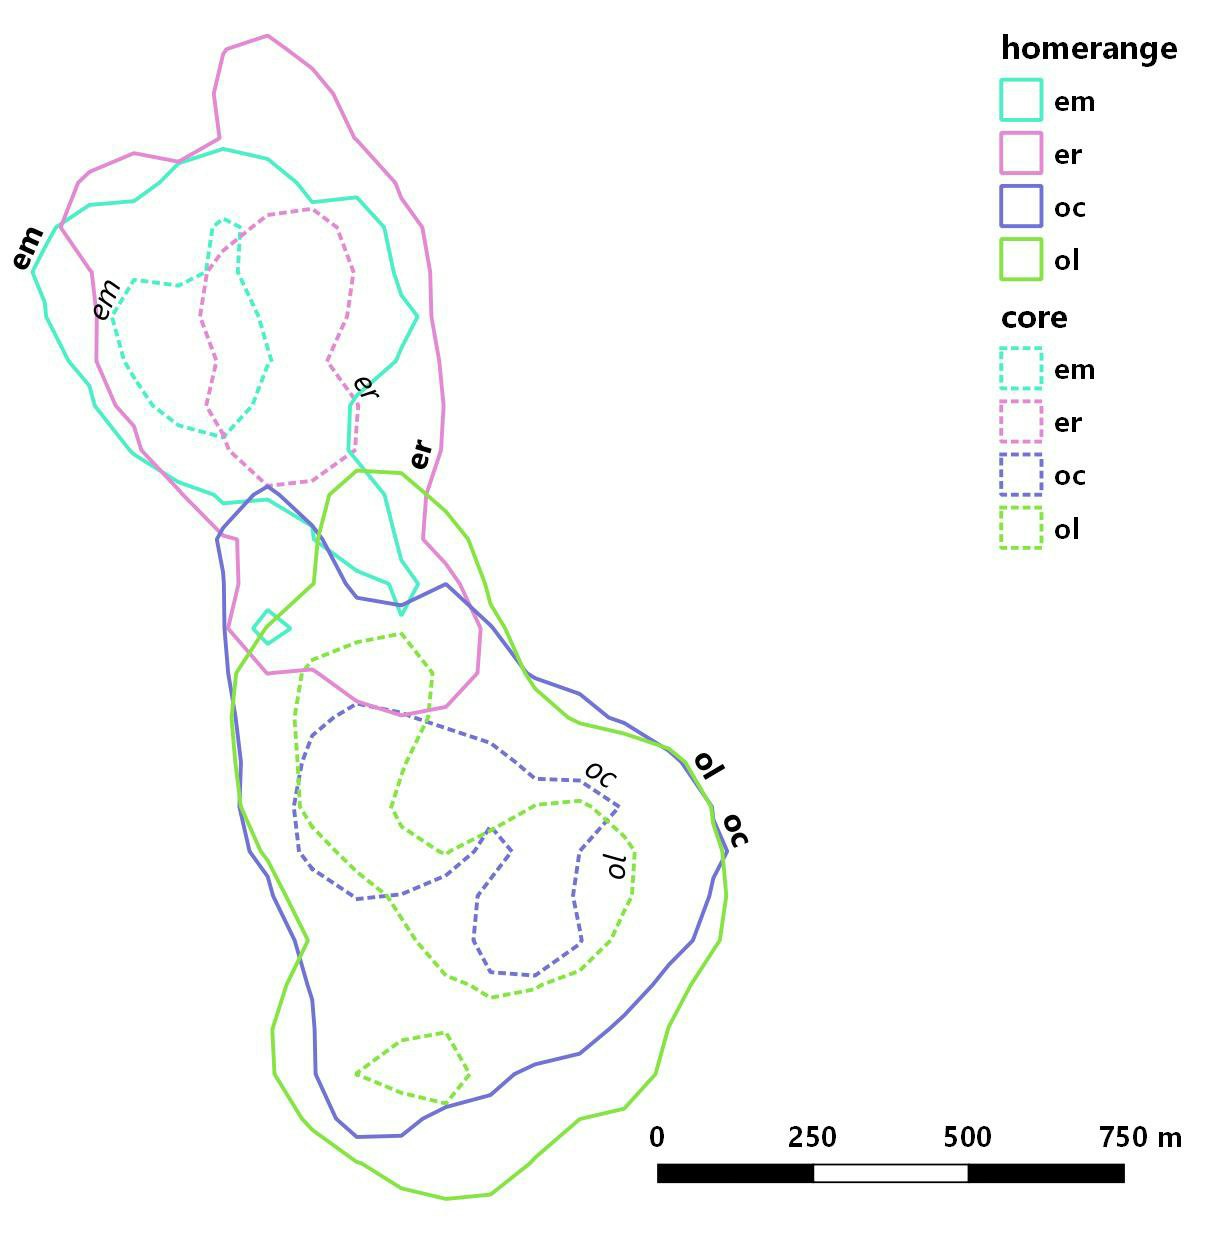
2 群に属するサル 4 個体の行動圏を個体別に推定し、それらの重複の程度を計算した。
同じ群れの個体どうしでは重複の程度が大きく、異なる群れの個体どうしでは小さい。
method="HR" の結果を見ると ol と oc は er と同程度重複しているとわかるが、
method="UDOI"の結果を見ると oc に比べて ol は er がよく使う場所で重複しているとわかる。
# directional measure なので行列の上三角部分と下三角部分で値が異なる
> kerneloverlaphr(ud, method="HR", conditional=TRUE)
              em           er           oc           ol
em 1.00000000000 0.9000000000 0.0400000000 0.0800000000
er 0.56962025316 1.0000000000 0.1772151899 0.2025316456
oc 0.02105263158 0.1473684211 1.0000000000 0.9263157895
ol 0.03539823009 0.1415929204 0.7787610619 1.0000000000

# non-directional measure なので行列の上三角部分と下三角部分で値が一致する
> kerneloverlaphr(ud, method="BA", conditional=TRUE)
               em            er             oc            ol
em 0.947844168220 0.73388969285 0.007852063737 0.01865634217
er 0.733889692849 0.94916341497 0.068987949541 0.09338369838
oc 0.007852063737 0.06898794954 0.947716806910 0.84595300967
ol 0.018656342169 0.09338369838 0.845953009667 0.94956657927
> kerneloverlaphr(ud, method="UDOI", conditional=TRUE)
                em             er              oc              ol
em 1.5214161021358 0.725429156990 0.0000665904131 0.0003707444207
er 0.7254291569898 1.554960055927 0.0049878745509 0.0102476928459
oc 0.0000665904131 0.004987874551 1.3443009511935 0.9116575687055
ol 0.0003707444207 0.010247692846 0.9116575687055 1.2245863425325
ちなみに実際の行動圏は以下のようなかんじ。
(ボールドのラベルは全体の行動圏、イタリックのラベルはコアエリア)

(※サンプルデータがあまりよくなかったので 2016/12/30 に現在のデータに差し替えた)
参考文献
Walter Applied Spatial Ecology Laboratory
http://ecosystems.psu.edu/research/labs/walter-lab/manual/chapter-5-overlap-indices
Fieberg J, Kochanny CO. 2005. Quantifying home-range overlap: the importance of the utilization distribution. Journal of Wildlife Management, 69(4), 1346-1359.
http://dx.doi.org/10.2193/0022-541X(2005)69[1346:QHOTIO]2.0.CO;2
Kochanny CO, Delgiudice GD, Fieberg J. 2009. Comparing global positioning system and very high frequency telemetry home ranges of white‐tailed deer. The Journal of Wildlife Management, 73(5), 779-787.
http://dx.doi.org/10.2193/2008-394
Clapp JG, Beck JL. 2015. Evaluating distributional shifts in home range estimates. Ecology and Evolution, 5(18), 3869–3878. http://doi.org/10.1002/ece3.1655