adehabitatHR パッケージ内の kernelUD ではさまざまなパラメータを設定してカーネル推定できる。
どのように指定すればいいのか迷うのでその一部にかんするメモを作成した。
基本的には adehabitatHR パッケージおよび使い方にかんする pdf の内容に沿っている。
grid
カーネル推定するために発生させるグリッドの大きさを指定できる。
小さく指定すれば推定結果がきめ細かくなり、大きく指定すれば推定結果が粗くなる。
※グリッドが小さすぎると以下のようなエラーが出る(データによる)。
g10<-getverticeshr(ud_g10,95)
Error in getverticeshr.estUD(x[[i]], percent, ida = names(x)[i], unin, :
The grid is too small to allow the estimation of home-range.
You should rerun kernelUD with a larger extent parameter
生息地選択などをする場合にラスタマップがある場合は、
そのグリッドサイズと合わせることもできる(今回は扱わない)。
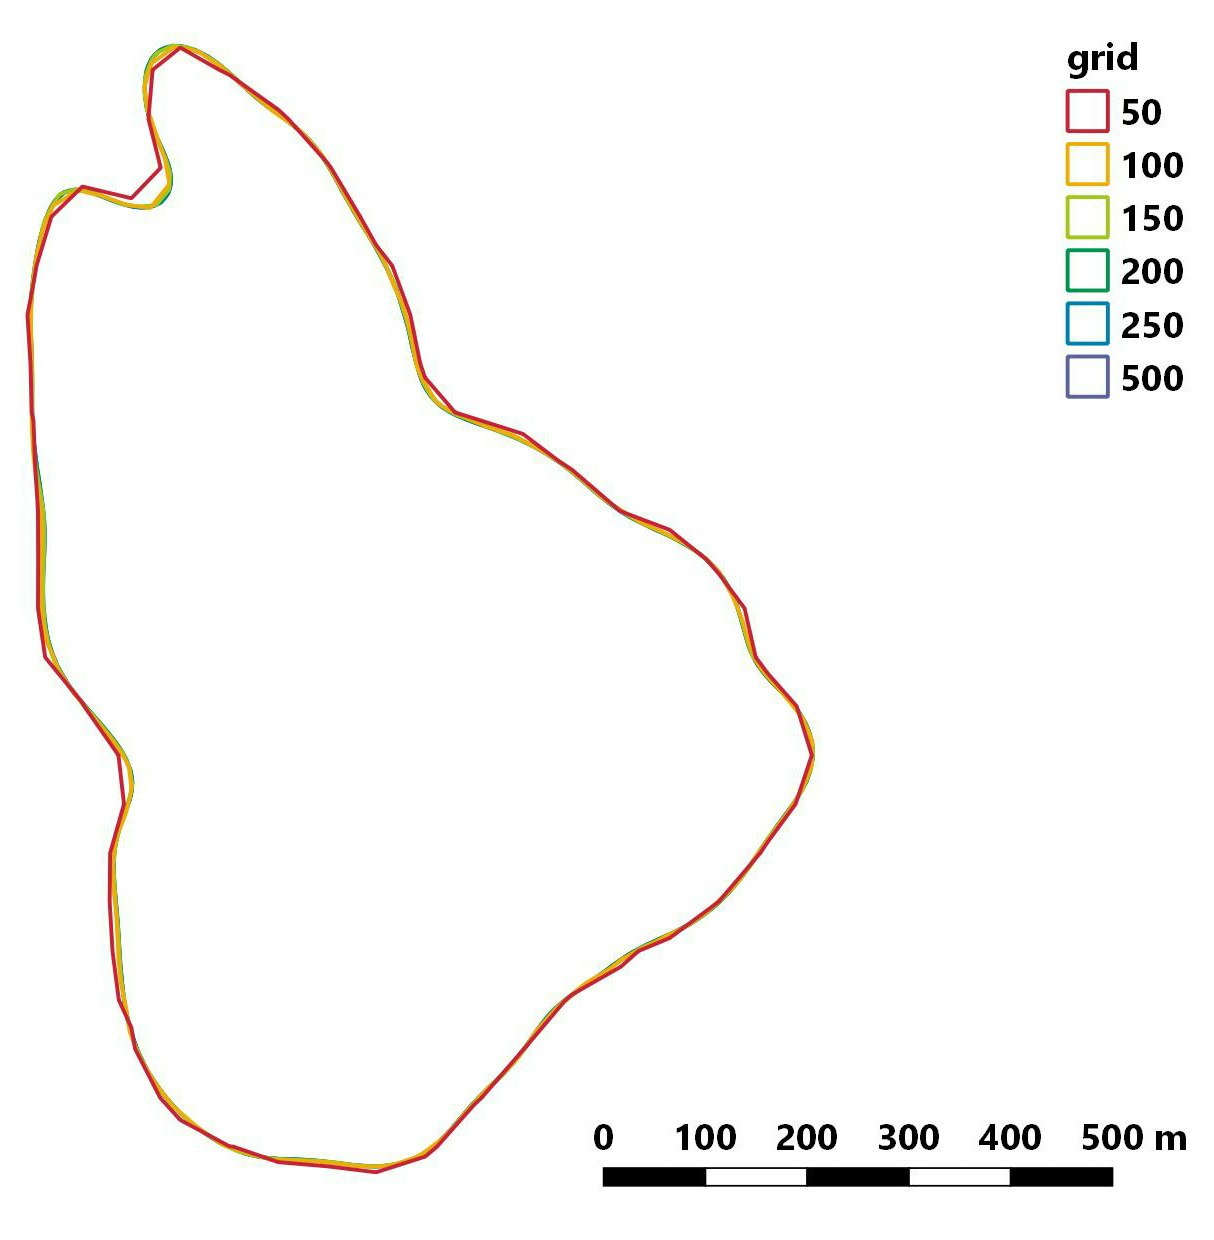
gridを変化させたときの行動圏の変化
他の記事でも使ったサルの位置データを用いて、
グリッドサイズを 50 から 500 まで変化させて行動圏を推定した。
他のパラメータは以下のようなかんじ。
ud<-kernelUD(data.xy,h ="href",grid=i,same4all=TRUE,hlim = c(0.1, 1.5),kern="bivnorm",extent=0.5)
50 のときにやや大きめに推定されているがほとんどグリッドサイズの影響はない。
たかだか 35 ha 程度と行動圏面積が小さい場合、あまり影響がない?
h
smoothing factor とよばれるパラメータ。
値を大きくすればするほど、なめらかな図形になる。
どのようにこの値を決めるかについていろいろ議論があるが、この記事ではふれない。
計算方法としては href と LSCV を指定できる。
h = "href" としていすると以下の式から h が計算される。
$h = σ × n^{1/6}$
$σ = 0.5 × (σ_x + σ_y)$
n は GPS ポイント数、σx と σy はそれぞれ x 座標と y 座標の標準偏差。
hlim
h = "LSCV" を指定しているときのみ有効。
hlim = c(a,b) という形で a と b を指定し、
ahref から bhref の範囲で LSCV を行う。
※href は ad hoc method で推定した smoothing factor のこと。
extent
カーネル推定するためにどれくらいの範囲にグリッドを発生させるかを指定できる。
基本的にはデフォルトのままでよい気がする。
adehabitatHR の使い方が説明されている pdf には以下のような説明がされている。
When a numeric value is passed to the parameter grid, the function kernelUD automatically computes the grid for the estimation. This grid is computed in the following way:
・the minimum and maximum coordinates ($X_{min}$, $X_{max}$, $Y_{min}$, $Y_{max}$) of the relocations are computed.
・the range of $X$ and $Y$ values is also computed (i.e., the difference between the maximum and minimum value). Let $R_X$ and $R_Y$ be these ranges.
・The coverage of the grid is defined thanks to the parameter extent of the function kernelUD. Let $e$ be this parameter. The minimum and maximum $X$ coordinates of the pixels of the grid are equal to $X_{min} − e × R_{X}$ and $X_{max} + e × R_X$ respectively. Similarly, the minimum and maximum $Y$ coordinates of the pixels of the grid are equal to $Y_{min} − e × R_{Y}$ and $Y_{max} + e × R_{Y}$ respectively.
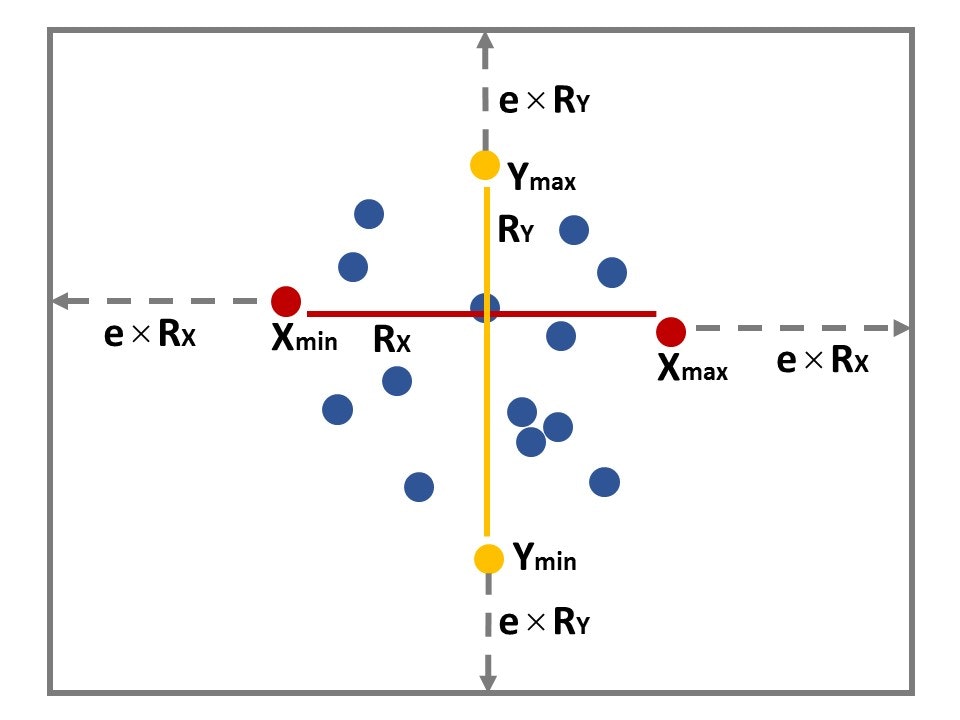
図示すると以下のようなかんじになるはず。
点は動物の位置情報を表す(端の点は赤・黄で示している)。
x 座標および y 座標のレンジ($R_x$ と $R_y$)、指定した extent の値($e$)をもとにグリッドがカバーする範囲を決める。
グリッドが発生する範囲はグレーで示している。
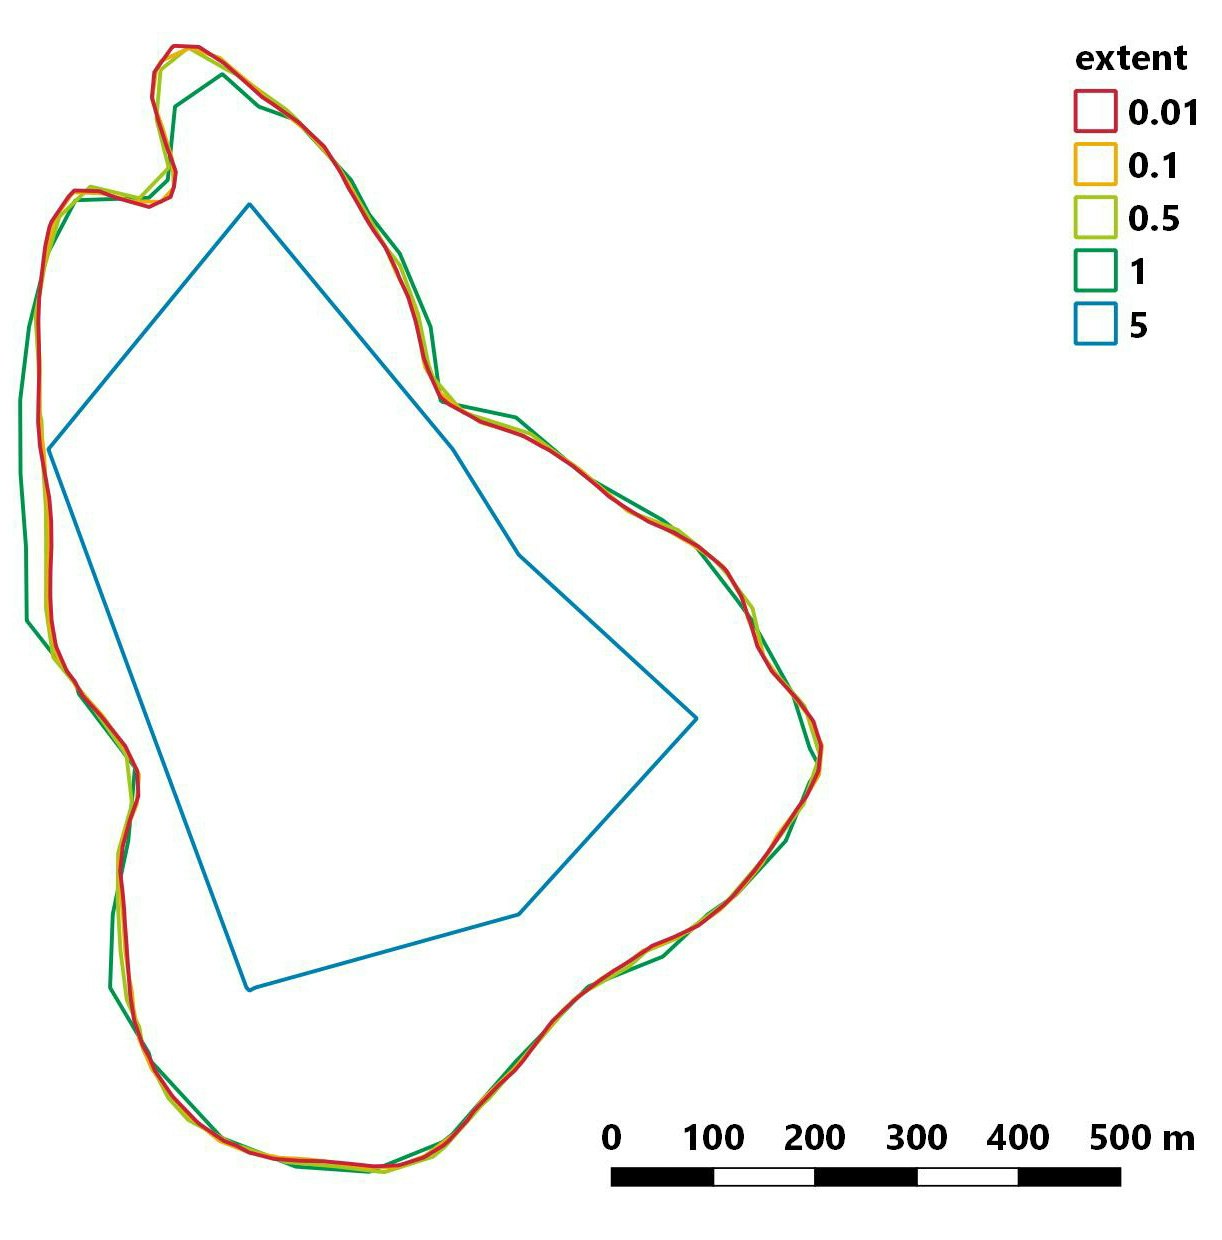
extentを変化させたときの行動圏の変化
grid と同様に extent を 0.01 から 5 まで変化させて行動圏を推定した。
他のパラメータは以下のようなかんじ。
ud<-kernelUD(data.xy,h ="href",grid=50,same4all=TRUE,hlim = c(0.1, 1.5),kern="bivnorm",extent=i)
extent が大きくなるほど位置データが含まれないグリッドがたくさん発生するので
傾斜の急な“山”が推定される?
参考文献
adehabitatHR
https://cran.r-project.org/web/packages/adehabitatHR/adehabitatHR.pdf
Home Range Estimation in R: the adehabitatHR Package
https://cran.r-project.org/web/packages/adehabitatHR/vignettes/adehabitatHR.pdf
尾崎研一, 工藤琢磨. 2002. 行動圏: その推定法, 及び観察点間の自己相関の影響 (< 特集 1> 哺乳類の行動圏研究の現状と将来及びテレメトリー法データ行動圏解析法). 日本生態学会誌, 52(2), 233-242.
http://ci.nii.ac.jp/naid/110001882168