Scikit-optimizeを使うと1行でベイズ最適化のコードをためせる。
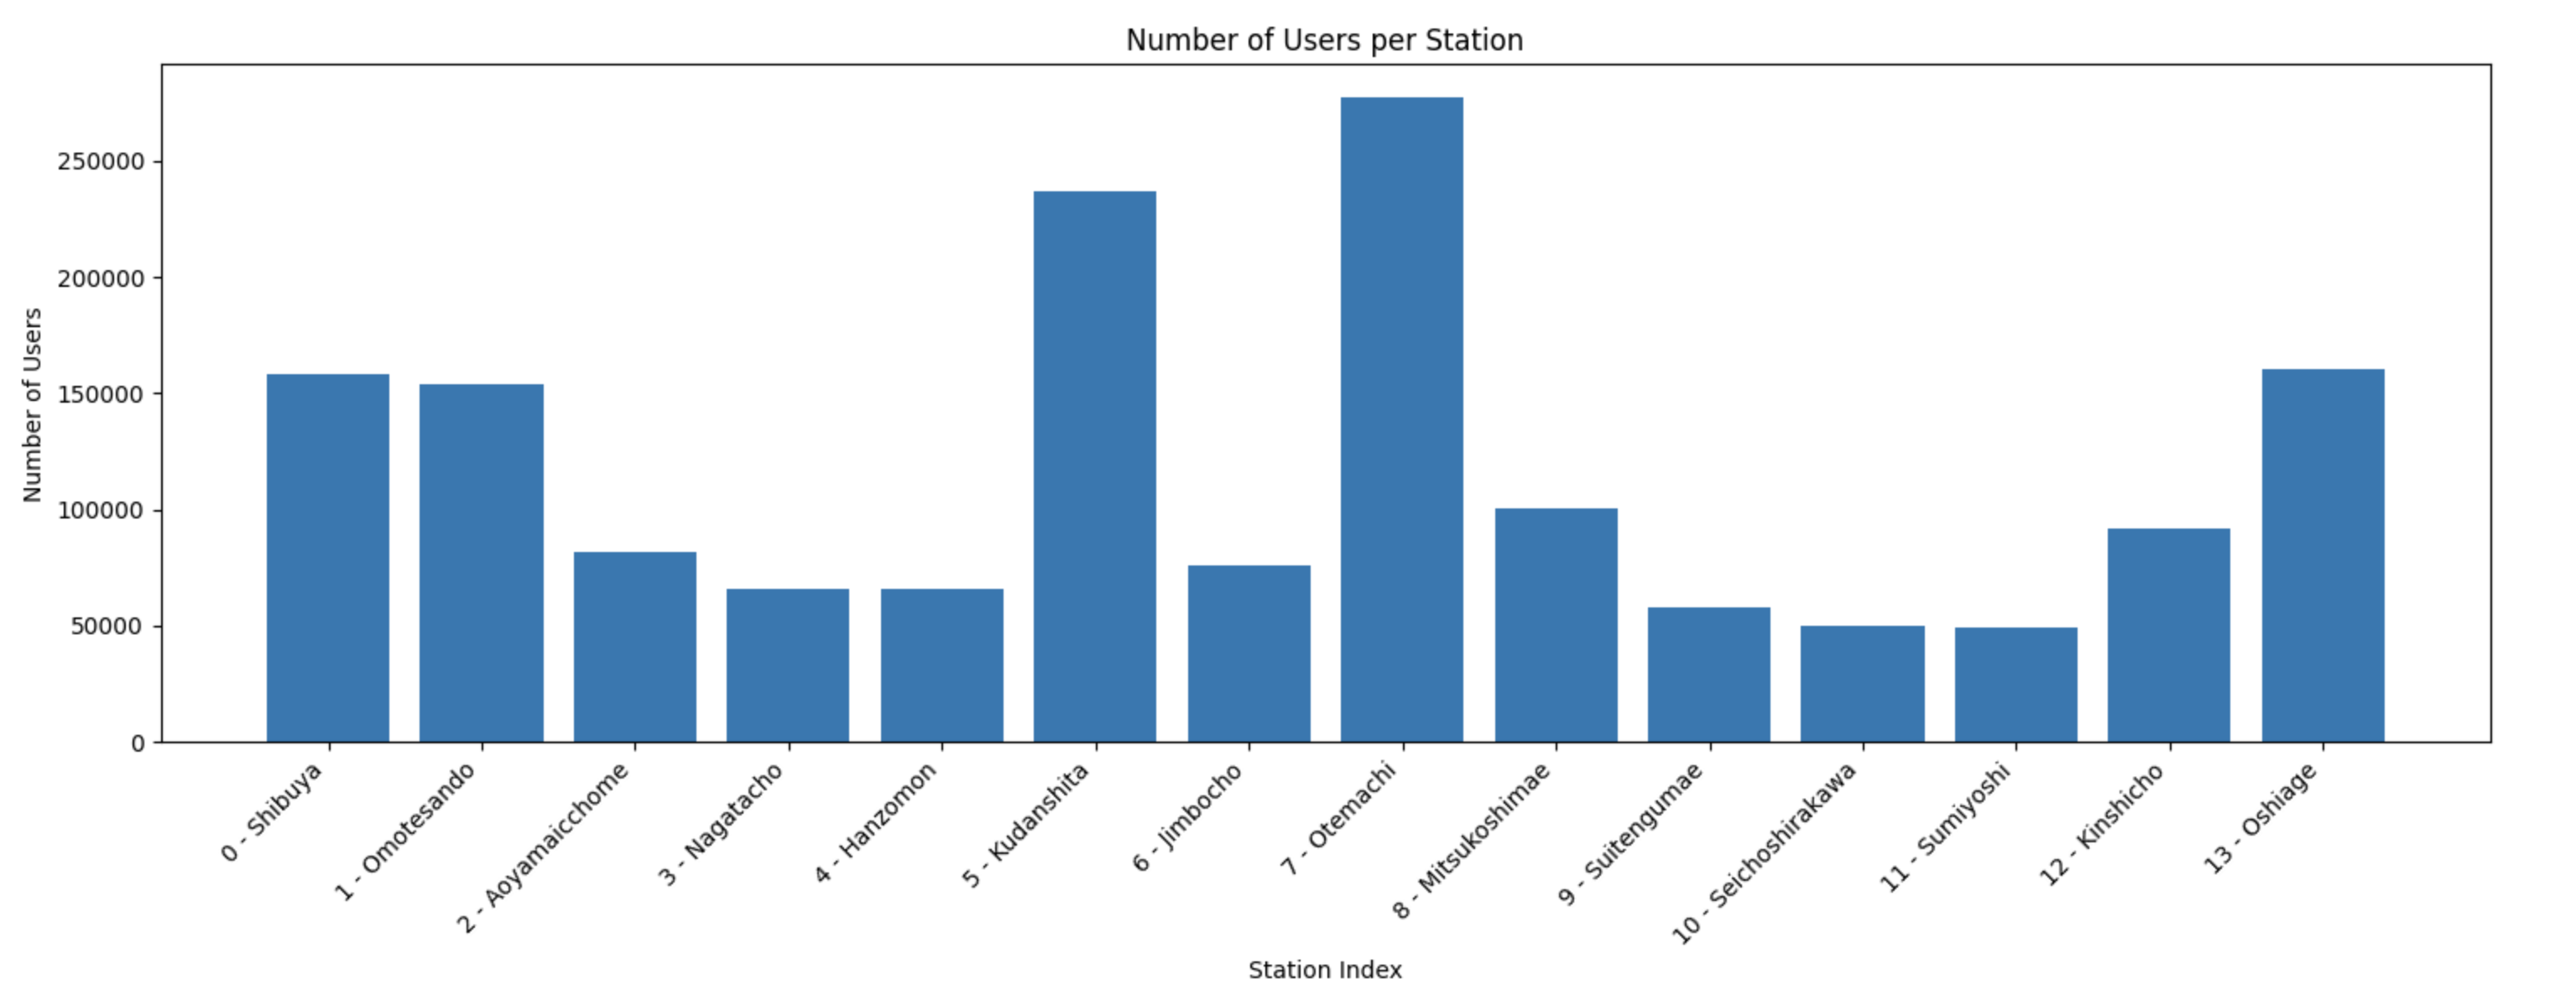
思いつきで半蔵門線の1日あたりの乗降者数をプロットしてみることにしました。これは探索区間が離散的な場合なので、おそらくベイズ最適化をする際にカーネルを適切に選ぶ必要もあるかもしれませんが、今回はライブラリーを使ってみるのを目的として、$[0,13]$の連続値を探索することにしつつ、intに丸めてそれに対応する乗降者数を返すような関数$f$を考えましょう。
import pandas as pd

data = [
    {'name': '0 - Shibuya', 'numOfUsers': 158056},
    {'name': '1 - Omotesando', 'numOfUsers': 154173},
    {'name': '2 - Aoyamaicchome', 'numOfUsers': 81621},
    {'name': '3 - Nagatacho', 'numOfUsers': 66041},
    {'name': '4 - Hanzomon', 'numOfUsers': 66059},
    {'name': '5 - Kudanshita', 'numOfUsers': 236661},
    {'name': '6 - Jimbocho', 'numOfUsers': 75986},
    {'name': '7 - Otemachi', 'numOfUsers': 277497},
    {'name': '8 - Mitsukoshimae', 'numOfUsers': 100581},
    {'name': '9 - Suitengumae', 'numOfUsers': 58180},
    {'name': '10 - Seichoshirakawa', 'numOfUsers': 49852},
    {'name': '11 - Sumiyoshi', 'numOfUsers': 49114},
    {'name': '12 - Kinshicho', 'numOfUsers': 92013},
    {'name': '13 - Oshiage', 'numOfUsers': 160493}
]

df = pd.DataFrame(data)

import matplotlib.pyplot as plt

plt.figure(figsize=(15, 6))
plt.bar(df['name'], df['numOfUsers'])
plt.xlabel('Station Index')
plt.ylabel('Number of Users')
plt.title('Number of Users per Station')
plt.xticks(rotation=45, ha='right')visibility
plt.tight_layout()
plt.show()
グラフにするとこんな感じです。意外と九段下と大手町が、渋谷や表参道よりも大きい点が興味深いです。また、押上では別の線との乗り換えのせいか、表参道や渋谷と同程度混雑しているようです。
前述の通り、駅のインデックスは離散的であるものの、単にライブラリを試すために$[0,13]$の連続値を適当に探索し、それをintで丸めて対応する駅の乗降者数を出すような関数$f$を考えましょう。
def f(x: float) -> int:
  print("x:", x)
  if (type(x) is float) or (type(x) is int):
    assert 0.0 <= x <= 13.0, "x is out of range."
    return df["numOfUsers"].to_list()[int(x)]
  elif type(x) is list:
    assert len(x) == 1
    assert 0.0 <= x[0] <= 13.0, "x is out of range."
    return df["numOfUsers"].to_list()[int(x[0])]
  else:
    raise ValueError("Something went wrong")
今回の変数$x$をlistでも処理できるようにしたのは、使用するライブラリがデフォルトでlistを代入してこようとするからです。さて、前述の$f$に対して、仮に大体11くらいの値が出れば、最も低い乗降者数の住吉駅が求められていることになります。(記憶の限り、私も住吉駅で降りたことはありません。)
実際のベイズ最適化の部分は、以下の1行となります。探索区間は2番目の引数のタプルにするようです。とてもシンプル。
print("Optimizer is trying the value of..")
result = gp_minimize(f, [(0.0, 13.0)])
printで中身を見ると、大体12回目くらいで住吉駅が人気のない駅だということがわかってきたようです。駅の数を考えると、結局ほぼ全ての駅を探索したことになります。これだと、別にベイズ最適化を使うまでもありませんね。
x: [1.0944991284688361]
x: [7.0848457367695135]
x: [10.607923923026966]
x: [2.847074881636229]
x: [10.81976021951222]
x: [8.458219140716253]
x: [3.619603459619761]
x: [6.86091924203403]
x: [3.3187141994756857]
x: [5.679477691075878]
x: [10.7349965973162]
x: [11.52860731064449]
x: [11.102056334365685]
x: [11.128787266453624]
x: [11.151929052133616]
x: [11.170554324454327]
x: [11.184374866785278]
x: [6.745565569574975]
x: [11.523707523472776]
x: [11.523356191033672]
x: [11.523382253493631]
...
n_callsを指定すれば探索の回数も決めることができます:
result = gp_minimize(f, [(0.0, 13.0)], n_calls=10)
また、どんな方針で探索が行われたかはgp_minimizeの値を見ればわかります。いろいろな情報が見えます。
          fun: 49114
            x: [11.873916584840202]
    func_vals: [ 81621  75986  49852 158056 236661 100581  49114  49852
                 58180  58180]
      x_iters: [[2.4926989693364714], [6.866124676846127], [10.907110926113072], [0.9307193201502985], [5.936950357894354], [8.177239054347368], [11.873916584840202], [10.881252045994355], [9.427446195074497], [9.762187356542213]]
       models: [GaussianProcessRegressor(kernel=1**2 * Matern(length_scale=1, nu=2.5) + WhiteKernel(noise_level=1),
                                        n_restarts_optimizer=2, noise='gaussian',
                                        normalize_y=True, random_state=2118755801)]
        space: Space([Real(low=0.0, high=13.0, prior='uniform', transform='normalize')])
 random_state: RandomState(MT19937)
        specs:     args:                    func: <function f at 0x786bc918d6c0>
                                      dimensions: Space([Real(low=0.0, high=13.0, prior='uniform', transform='normalize')])
                                  base_estimator: GaussianProcessRegressor(kernel=1**2 * Matern(length_scale=1, nu=2.5),
                                                                           n_restarts_optimizer=2, noise='gaussian',
                                                                           normalize_y=True, random_state=2118755801)
                                         n_calls: 10
                                 n_random_starts: None
                                n_initial_points: 10
                         initial_point_generator: random
                                        acq_func: gp_hedge
                                   acq_optimizer: auto
                                              x0: None
                                              y0: None
                                    random_state: RandomState(MT19937)
                                         verbose: False
                                        callback: None
                                        n_points: 10000
                            n_restarts_optimizer: 5
                                              xi: 0.01
                                           kappa: 1.96
                                          n_jobs: 1
                                model_queue_size: None
                                space_constraint: None
               function: base_minimize
おそらく半蔵門線の例は良い例ではなかったため、また別の例を考えて試してみます。また気が向いたら書きます。
Scikit-optimizeを使うと1行でベイズ最適化のコードをためせる。