はじめに
※ページが重いため速度制限等注意
こんな方にオススメ。
・matplotlibを大枠で把握したい方
・描画でやりたいことの頭出しを知りたい方
・すぐ動かせるサンプルソースを探している方
概要
| matplotlib直下のクラス名 | 概要 |
|---|---|
| afm | Adobe Font Metrics FilesへのPythonインタフェース |
| animation | グラフ描写をアニメーション表現 |
| artist | FigureCanvasレンダリングする人のための抽象基本クラス。 |
| axes | Axesには、Axis、Tick、Line2D、Text、PolygonなどのほとんどのFigure要素が含まれ、座標系を設定します。 |
| axis | 目盛りとxおよびy軸のクラス。 |
| backend_bases | FigureCanvasBase:描画を担当するバックエンドの抽象基底クラス |
| backend_managers | ツール操作のイベント(追加/削除)。 |
| backend_tools | 抽象基本クラスは、ツールのプリミティブを定義します。これらのツールはmatplotlib.backend_managers.ToolManagerによって使用されます |
| backends | High Fidelity 2D Graphicsの機能を実装 |
| freetype2 | フォントエンジンを実装したライブラリ |
| blocking_input | Figureウィンドウとの対話をブロックするために使用されるいくつかのクラスが提供されます。 |
| category | このモジュールは、Matplotlibのmatplotlib.unitsメカニズムを使用して、文字列から整数に変換し、ティックロケーターとフォーマッター、および文字列から整数へのマッピングを作成して保存するclass:UnitDataを提供します。 |
| cbook | ユーティリティ関数とクラスのコレクション。もともと、Python Cookbookからのものでした。したがって、cbookという名称。 |
| cm | 組み込みのカラーマップ、カラーマップ処理ユーティリティ、およびScalarMappableミックスイン。 |
| collections | ほとんどのプロパティを共有するオブジェクトの大規模なコレクションを効率的に描画するためのクラス。たとえば、多数のラインセグメントまたはポリゴン。条件を指定して描画するイメージ。 |
| colorbar | 2つのクラスと関数を備えたColorbarツールキット |
| colors | Matplotlibで色を制御するモジュール |
| container | コンテナは、棒グラフの棒などの意味的に関連するartistを収集するクラス |
| contour | これらは、Axesクラスの等高線図とラベル付けをサポートするクラスです。 |
| dates | Matplotlibは、python datetimeとアドオンモジュールdateutilの肩に立つ洗練された日付プロット機能を提供します。 |
| dviread | TeXが出力するdviファイルを読み込むためのモジュール。 |
| figure | figureモジュールは、すべてのプロット要素を含む最上位のArtist、Figureを提供します。 |
| font_manager | プラットフォーム間でフォントを検索、管理、使用するためのモジュール。 |
| fontconfig_pattern | fontconfigパターンを解析および生成するためのモジュール。 |
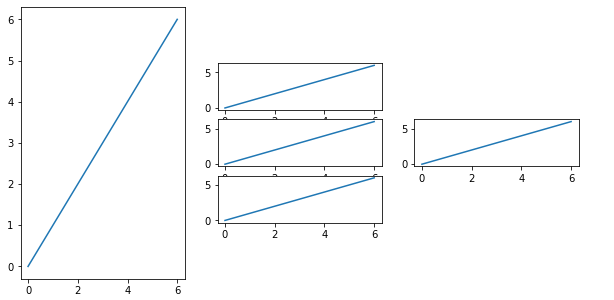
| gridspec | gridspecには、Figure内のグリッドのようなパターンで複数のAxesをレイアウトするのに役立つクラスが含まれています。複数のグラフレイアウトを制御したい場合に使用。 |
| image | 画像モジュールは、基本的な画像の読み込み、再スケーリング、表示操作をサポートしています。 |
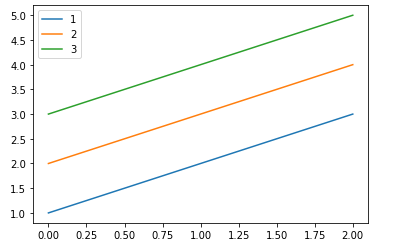
| legend | legendモジュールはLegendクラスを定義します。これは、軸や図形に関連付けられた凡例を描画する役割を果たします。 |
| legend_handler | このモジュールは、デフォルトの凡例ハンドラーを定義します。 |
| lines | このモジュールには、さまざまなラインスタイル、マーカー、色で描画できる2Dラインクラスがすべて含まれています。 |
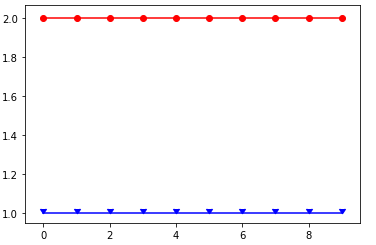
| markers | このモジュールには、マーカーを処理する関数が含まれています。 |
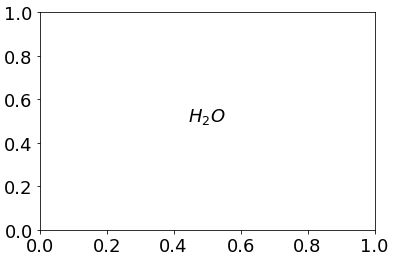
| mathtext | mathtextは、TeX数学構文のサブセットを解析し、matplotlibバックエンドに描画するためのモジュールです。 |
| mlab | 同じ名前のMATLABコマンドとの互換性のために記述された数値Python関数。ほとんどの数値Python関数は、numpyおよびscipyライブラリにあります。ここに残っているのは、スペクトル計算を実行するためのコードです。 |
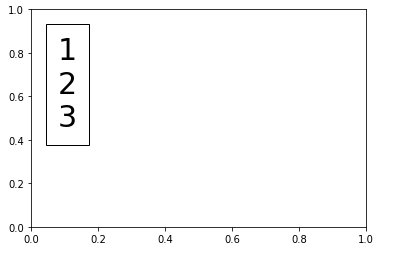
| offsetbox | OffsetBoxはシンプルなコンテナーartistです。子artistは、親に対して相対的な位置に描画されることを意図しています。DrawingArea、およびTextAreaは、OffsetBoxから派生しています。 |
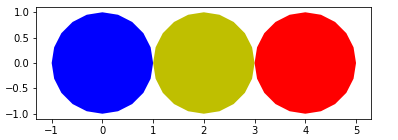
| patches | matplotlibの簡易的な図形描写モジュール |
| path | Matplotlib全体で使用されるポリラインを処理するためのモジュール。 |
| patheffects | キャンバス上でオブジェクトがたどるパスを定義します。 |
| pyplot | matplotlib.pyplotは、matplotlibへの状態ベースのインターフェースです。MATLABのようなプロット方法を提供します。pyplotは主に、インタラクティブなプロットとプログラムによるプロット生成の単純なケースを対象としています。" |
| projections | 投影について管理しているクラス |
| projections.polar | 極座標変換の逆数。デカルト座標空間xとyをthetaとrに戻します。 |
| rcsetup | rcsetupモジュールには、matplotlibのrc設定を使用してカスタマイズするためのデフォルト値と検証コードが含まれています。 |
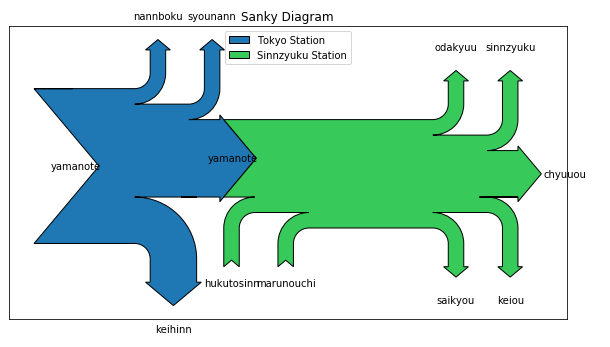
| sankey | matplotlibを使ってSankeyダイアグラムを作成するためのモジュール |
| scale | 軸等に対してユーザー指定の機能を備えた任意のスケール(拡大、縮小)を提供します。 |
| spines | 軸スパイン - データ領域の境界を示す線 |
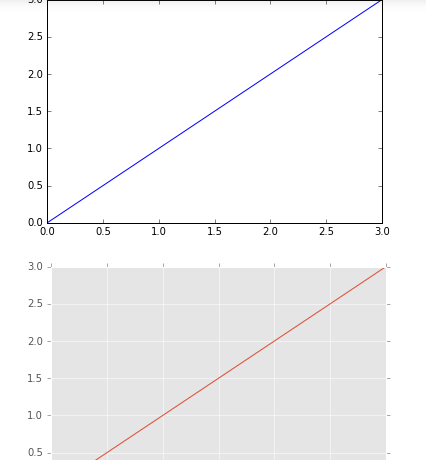
| style | スタイル設定を一時的に使用するコンテキストマネージャ。 |
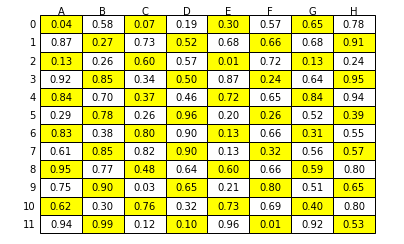
| table | matplotlib で図に表 (テーブル) を付加する |
| testing | テスト用のHelper関数。 |
| text | 図にテキストを含めるためのクラス。 |
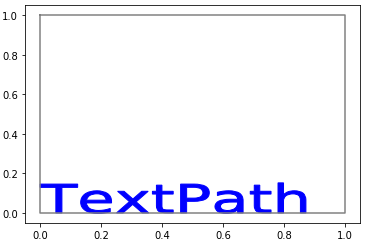
| textpath | テキストからパスを作成します。それは単なるパスであり、artistではないことに注意してください。このパスをキャンバスに描画するには、PathPatch(または他のアーティスト)を使用する必要があります。 |
| ticker | このモジュールには、完全に構成可能なティックの配置と書式設定をサポートするクラスが含まれています。 |
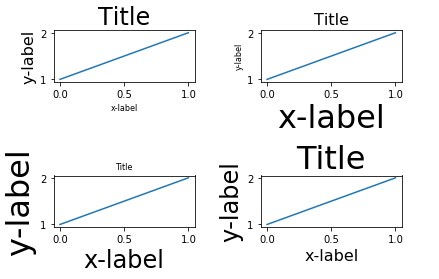
| tight_layout | このモジュールは、サブプロットが図にうまく収まるようにサブプロットパラメータを調整するルーチンを提供します。その際、軸に固定されている軸ラベル、目盛りラベル、軸タイトル、オフセットボックスのみが現在考慮されています。 |
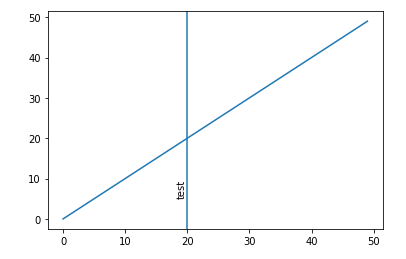
| transforms | matplotlibは、キャンバスに描画されたすべての要素の最終的な位置を決定するために使用される任意の幾何学的変換の枠組みを含みます。Transformは、実際の値が子に依存するTransformNodeオブジェクトのツリーに構成されます。子供の内容が変わると、その親は自動的に無効になります。次に無効化されたトランスフォームにアクセスすると、それらの変更を反映するために再計算されます。この無効化/キャッシングのアプローチは、変換の不必要な再計算を防ぎ、対話型のパフォーマンスを向上させます。 |
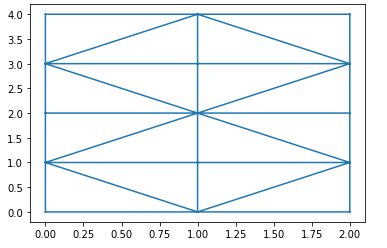
| tri | 非構造化三角グリッド関数。三角形は、ユーザによって指定されるか、Delaunay三角測量を使用して自動的に生成されます。 |
| type1font | このモジュールには、タイプ1フォントを表すクラスが含まれています。pfaファイルとpfbファイルが読み込まれ、pdfファイルに埋め込まれます。また、pdfTeXやフレンドと同様に、SlantFontとExtendFontの変換もサポートしています。 |
| units | ここのクラスはMatplotlibでカスタムクラスを使用するためのサポートを提供します。例えば、配列インタフェースを公開していないが、配列への変換方法を知っているクラスなどです。単位変換と単位変換を持つクラスもサポートしています。 |
| widgets | 任意のGUIバックエンドで動作するように設計されたウィジェット。 |
詳細
一部理解しきれていないものは調査中とさせていただいております。
afm
調査中
animation
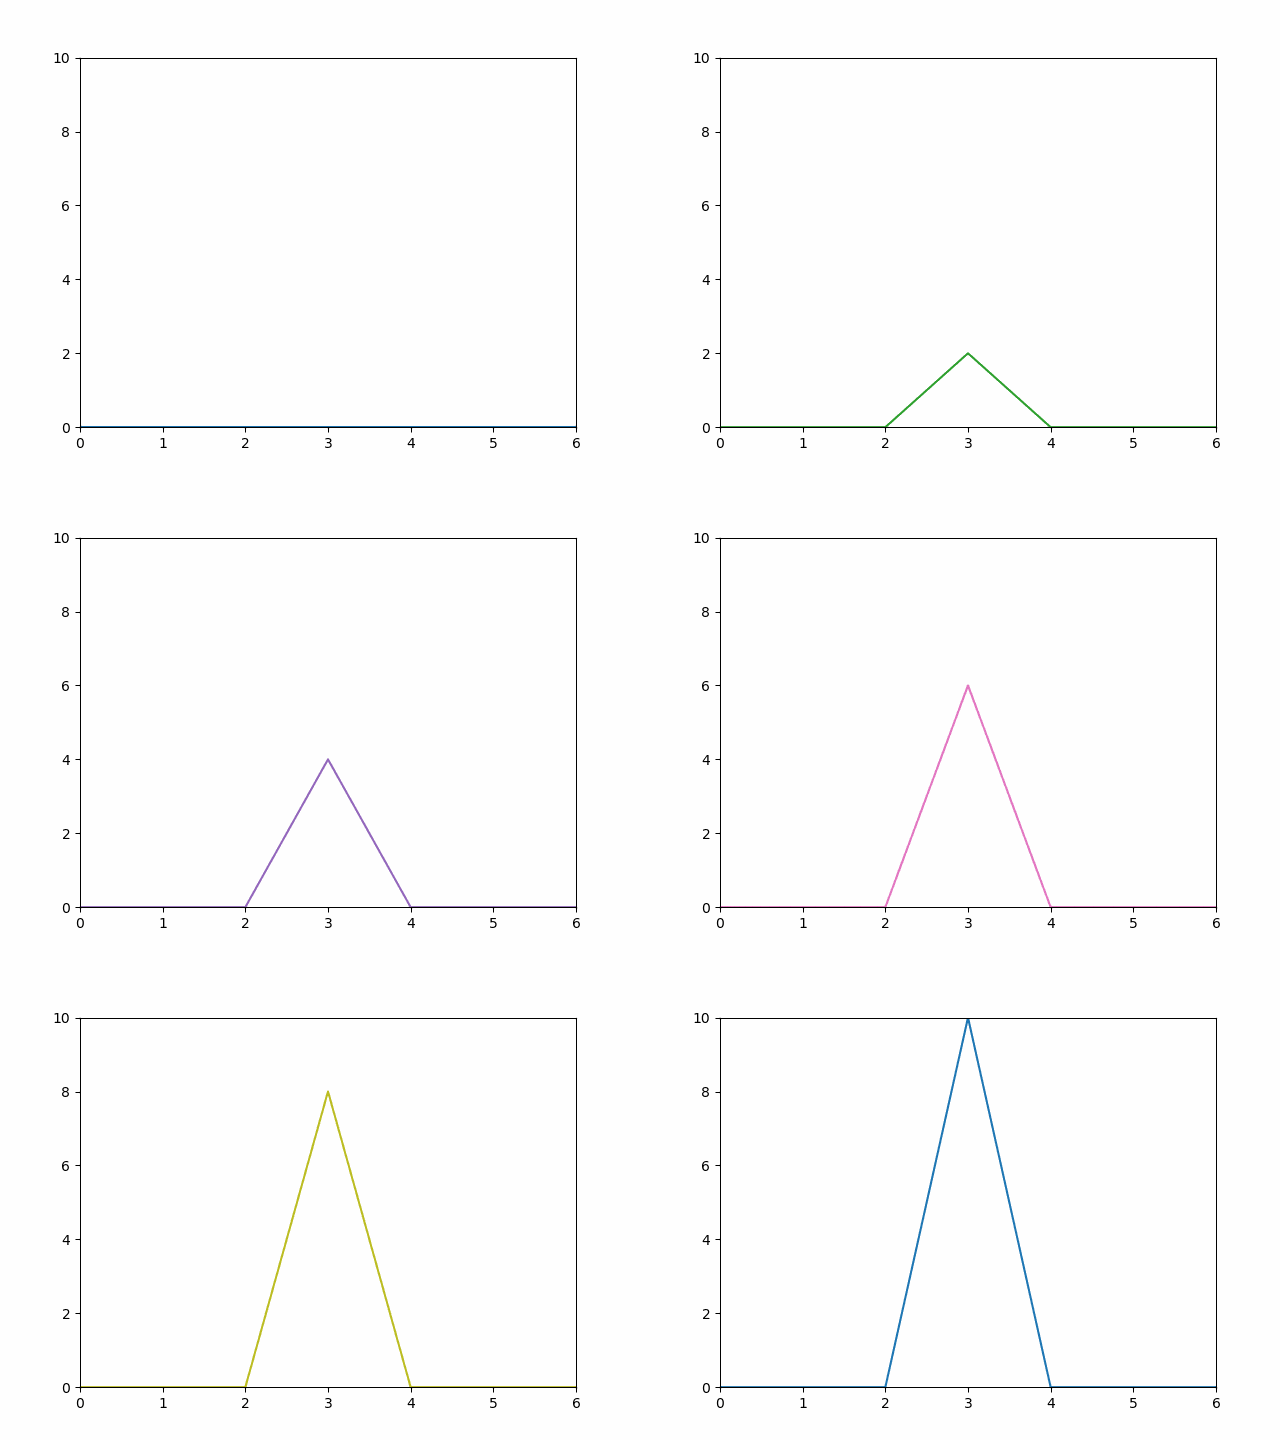
アニメーションで使用するメソッドは以下2点。
・ArtistAnimation:作成済の配列を元に、アニメーションを流すイメージ。(有限)
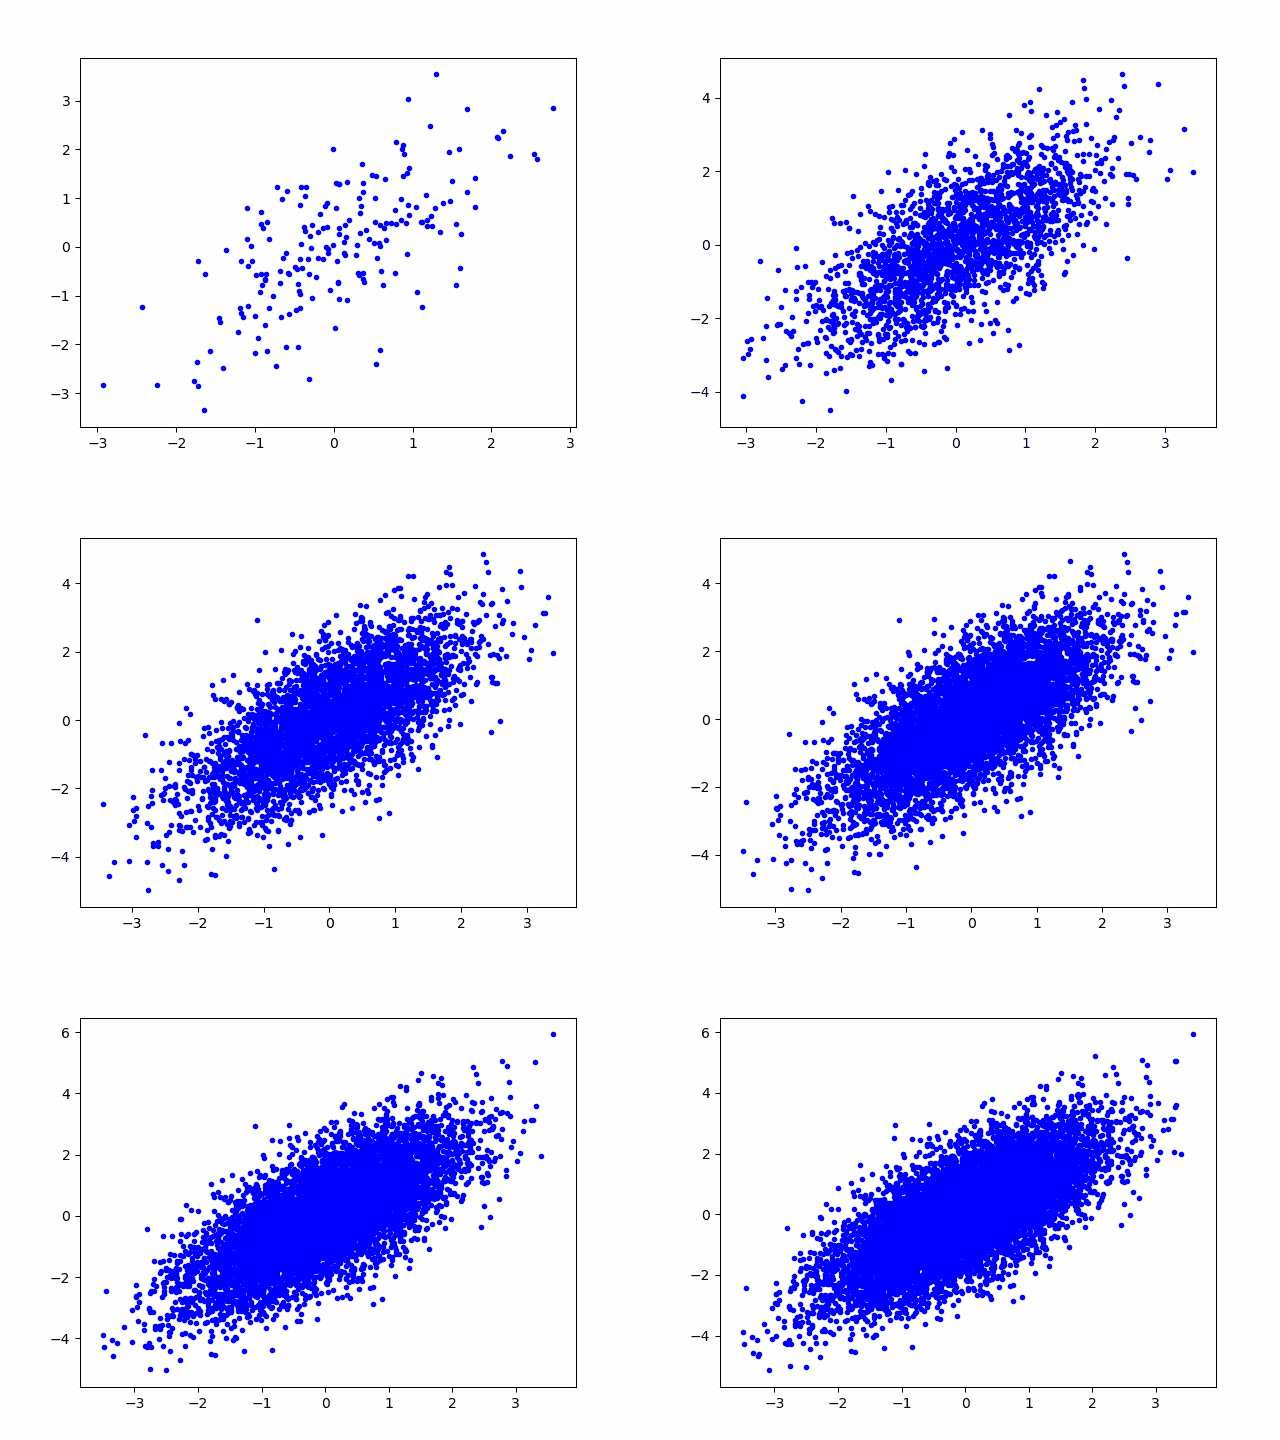
・FuncAnimation:ある処理を常にプロット→アニメーションを繰り返し流すイメージ。(無限)
"""
たけのこ成長記録
"""
# Jupyter上でアニメーションが再生可能にするため、matplotlibのnbaggを有効
%matplotlib nbagg

import matplotlib.pyplot as plt
import matplotlib.animation as animation

fig = plt.figure() # 表作成
plt.xlim(0, 6) # x軸の範囲
plt.ylim(0, 10) # y軸の範囲

ims = [] # グラフ描画配列
arr = [0, 0, 0, 0, 0, 0, 0] # グラフ配列初期値

for i in range(11): # i = 0~10までループ
    arr[3] = i # 成長具合
    im = plt.plot(arr) # 成長記録のプロット取得
    ims.append(im) # グラフ描画配列に追加

# 11枚のプロット(成長記録)を 300ms ごとにアニメーション表示
ani = animation.ArtistAnimation(fig, ims, interval=300)

ani.save("img/animation_ArtistAnimation.gif", writer="imagemagick") #カレントディレクトリにGIFファイル出力
plt.show()
"""
雨粒から水溜りへ
"""
%matplotlib nbagg

import numpy as np
import matplotlib.pyplot as plt
import matplotlib.animation as animation

fig = plt.figure() # 表作成

def plot(data):
    x = np.random.randn(100) # X軸に100個の乱数
    y = x + np.random.randn(100)# Y軸に100個の乱数
    im = plt.plot(x, y, "b.") # 描画

# 300ms ごとにplot()結果をアニメーション表示
ani = animation.FuncAnimation(fig, plot, interval=300)
ani.save("img/animation_FuncAnimation.gif", writer="imagemagick") #カレントディレクトリにGIFファイル出力
plt.show()
artist
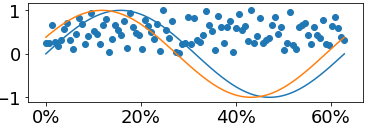
import numpy as np
import matplotlib.pyplot as plt
import matplotlib.ticker as ticker # FormatterとLocatorはTickerモジュールが必要

x = np.linspace(0, 2*np.pi, 100) # データ

# Figureクラス(グラフの箱を生成)
fig = plt.figure()

# Axesクラス(グラフデータの描画を生成)
ax = fig.add_subplot(211)
line1 = ax.plot(x, np.sin(x), label='1st plot') # 1つ目のAxes.lines
line2 = ax.plot(x, np.sin(x+np.pi/8), label='2nd plot') # 2つ目のAxes.lines
scat = ax.scatter(x, np.random.rand(len(x)), label='scatter') # 3つ目のAxes.collections


# Axisクラス(XY軸についての設定)
ax.xaxis.set_major_formatter(ticker.PercentFormatter(xmax=10))


# Tickクラス(書式設定等)
plt.tick_params(labelsize=18) # XY軸のラベルサイズを設定

fig.show()
axes
artist参照
axis
artist参照
backend_bases
調査中
backend_managers
調査中
backend_tools
調査中
backends
調査中
freetype2
調査中
blocking_input
調査中
category
調査中
cbook
ユーティリティの一例として、平坦化処理
from matplotlib.cbook import flatten
l = (('John', ['Hunter']), (1, 23), [[([42, (5, 23)], )]])
print(l) # 平坦化前
print(list(flatten(l))) # 平坦化後
cm
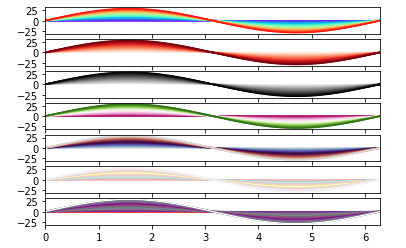
色の制御。配色設定値は以下参照。
https://matplotlib.org/gallery/color/colormap_reference.html
import matplotlib.pyplot as plt
import matplotlib.cm as cm
import numpy as np

fig, (ax1,ax2,ax3,ax4,ax5,ax6,ax7) = plt.subplots(nrows=7,sharex=True)

x =np.linspace(0,2*np.pi,100)
for i in range(30):
    y=i*np.sin(x)
    ax1.plot(x, y, color=cm.rainbow(i/30.0))
    ax2.plot(x, y, color=cm.Reds(i/30.0))
    ax3.plot(x, y, color=cm.binary(i/30.0))
    ax4.plot(x, y, color=cm.PiYG(i/30.0))
    ax5.plot(x, y, color=cm.twilight(i/30.0))
    ax6.plot(x, y, color=cm.Pastel1(i/30.0))
    ax7.plot(x, y, color=cm.flag(i/30.0))

ax1.set_xlim(0, 2*np.pi)
fig.show()
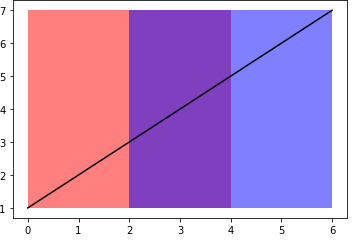
collections
条件付グラフ描画
import numpy as np
import matplotlib.pyplot as plt
import matplotlib.collections as collections

x = np.array([0,1,2,3,4,5,6])
y = np.array([1,2,3,4,5,6,7])

fig = plt.figure()
fig_subplot = fig.add_subplot(111)

fig_subplot.plot(x, y, color='black')

# y軸の値が5以下は赤塗
p_ymin=1
p_ymax=7
p_where=y<=5
p_facecolor='red'
p_alpha=0.5
collection = collections.BrokenBarHCollection.span_where(x, ymin=p_ymin, ymax=p_ymax, where=p_where, facecolor=p_facecolor, alpha=p_alpha)
fig_subplot.add_collection(collection)

# y軸の値が3以上は青塗
p_where=y>=3
p_facecolor='blue'
collection = collections.BrokenBarHCollection.span_where(x, ymin=p_ymin, ymax=p_ymax, where=p_where, facecolor=p_facecolor, alpha=p_alpha)
fig_subplot.add_collection(collection)

# y軸の値が3~5は重なるため紫塗となる
fig.show()
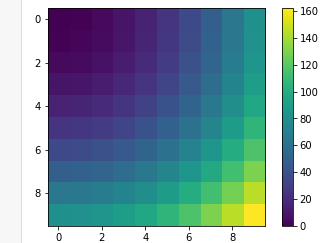
colorbar
import numpy as np
import matplotlib.pyplot as plt
from matplotlib.cm import get_cmap

x = np.arange(10)
y = np.arange(10)
X, Y = np.meshgrid(x, y)
Z = X**2. + Y**2.

fig = plt.figure()
ax1 = fig.add_subplot(111)
im = ax1.imshow(Z, interpolation='none')
fig.colorbar(im)

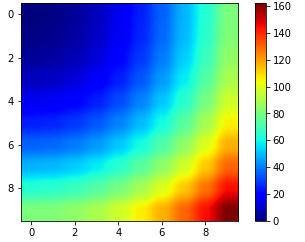
# 色彩と境目表現について変更
fig2 = plt.figure()
ax2 = fig2.add_subplot(111)
im2 = ax2.imshow(Z, cmap=get_cmap('jet'), interpolation='hermite')
fig2.colorbar(im2)

fig.show()
colors
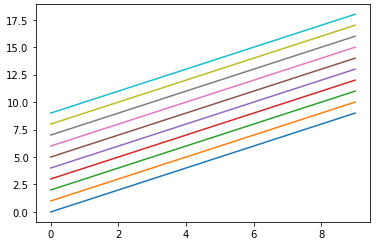
matplotlib.colors.ListedColormapの例
campという表現を良く見るが、「ListedColormap」の略語。
import matplotlib.pyplot as plt
import numpy as np

fig = plt.figure()
ax = fig.add_subplot(111)

a = np.arange(10)
cmap = plt.get_cmap("tab10") # 色情報取得

for i in range(10):
    ax.plot(a,a+i, color=cmap(i))

plt.show()
container
調査中
contour
調査中
dates
調査中
dviread
調査中
figure
artist参照
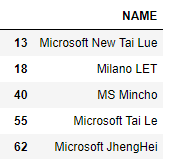
font_manager
import matplotlib.font_manager as fm
import pandas as pd

serch_str = 'Mi' # 検索文字列

arr = []
for fname in fm.findSystemFonts():
    font = fm.FontProperties(fname=fname)
    arr.append(font.get_name())
dt_fm = pd.DataFrame(arr, columns=['NAME'])
dt_fm[dt_fm['NAME'].apply(lambda s: serch_str in s)]
fontconfig_pattern
調査中
gridspec
import matplotlib as mpl
import matplotlib.pyplot as plt
from matplotlib.gridspec import GridSpec, GridSpecFromSubplotSpec

arr = [0, 1, 2, 3, 4, 5, 6]
figure = plt.figure(figsize=(10, 5))

# レイアウト枠設定(5行3列)
p_nrows=5
p_ncols=3
gs_master = GridSpec(nrows=p_nrows, ncols=p_ncols, height_ratios=[1, 1, 1, 1, 1])
# 1列目
gs_1 = GridSpecFromSubplotSpec(nrows=p_nrows, ncols=1, subplot_spec=gs_master[0:5, 0])
axes_1 = figure.add_subplot(gs_1[:, :])
axes_1.plot(arr)
# 2列目
gs_2_3_4 = GridSpecFromSubplotSpec(nrows=p_nrows, ncols=2, subplot_spec=gs_master[0:5, 1])
axes_2 = figure.add_subplot(gs_2_3_4[1, :])
axes_3 = figure.add_subplot(gs_2_3_4[2, :])
axes_4 = figure.add_subplot(gs_2_3_4[3, :])
axes_2.plot(arr)
axes_3.plot(arr)
axes_4.plot(arr)
# 3列目
gs_5= GridSpecFromSubplotSpec(nrows=p_nrows, ncols=3, subplot_spec=gs_master[0:5, 2])
axes_5 = figure.add_subplot(gs_5[2, :])
axes_5.plot(arr)

plt.show()
image
import matplotlib.pyplot as plt
import matplotlib.image as mpimg
import numpy as np

fig = plt.figure()
ax =  fig.add_subplot(111)

# 画像読み込み(PNG)
img = mpimg.imread('img/matplotlib_image.png')
print("↓PNGの形式の画像読み書きはfloat32データ↓\r\n", img)
# 画像読み込み(PNG以外)
img = mpimg.imread('img/matplotlib_image.jpg')
print("↓PNG以外の形式の画像読み書きはuint8データ↓\r\n", img)

plt.imshow(img)
legend
import matplotlib.pyplot as plt
import matplotlib.legend as lgd

fig = plt.figure()

ax = fig.add_subplot(111)
arr = [1,2,3]
line = ax.plot(arr)

ax2 = fig.add_subplot(111)
arr2 = [2,3,4]
line2 = ax2.plot(arr2)

ax3 = fig.add_subplot(111)
arr3 = [3,4,5]
line3 = ax3.plot(arr3)

# 1つ目の凡例生成
leg1 = ax.legend(line, ["1"], ncol=1)
# 2つ目の凡例を生成
leg2 = lgd.Legend(ax2, line2, ["2"], ncol=2)
# 3つ目の凡例を生成
leg3 = lgd.Legend(ax3, line3, ["3"], ncol=3)

# 1つ目の凡例に2つ目の凡例を追加
leg1._legend_box._children.append(leg2._legend_box._children[1])
# 1つ目の凡例に3つ目の凡例を追加
leg1._legend_box._children.append(leg3._legend_box._children[1])
# デフォルト中央寄せのため、左寄せ
leg1._legend_box.align="left"

fig.show()
legend_handler
調査中
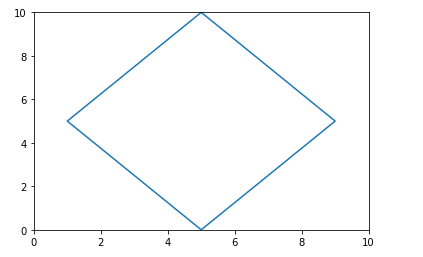
lines
import matplotlib.pyplot as plt
from matplotlib.lines import Line2D

fig = plt.figure()
ax = fig.add_subplot(111)
# 座標(5,10),(1,5)・・・と線描画
x = [5,1,5,9,5]
y = [10,5,0,5,10]
line = Line2D(x, y)
ax.add_line(line)
ax.set_xlim(0, 10)
ax.set_ylim(0, 10)

plt.show()
markers
import matplotlib.pyplot as mplt
from matplotlib.markers import CARETDOWN

data = [2.]*10
data2 = [1.]*10

mplt.plot(data, 'r-')
mplt.plot(data2, 'b-')
mplt.scatter(range(10), data, facecolor='r') # 上部
mplt.scatter(range(10), data2, marker=CARETDOWN, facecolor='b') # 下部

mplt.show()
mathtext
import matplotlib.pyplot as plt
from matplotlib import mathtext

mathtext.FontConstantsBase = mathtext.ComputerModernFontConstants
# Hと2の間に違い
# mathtext.FontConstantsBase = mathtext.STIXSansFontConstants

plt.rcParams.update({'font.size': 18})

plt.text(0.5, 0.5, '$H_2O$', ha='center')

plt.show()
mlab
調査中
offsetbox
import matplotlib.pyplot as plt
import matplotlib.offsetbox as offsetbox

fig = plt.figure()
ax = fig.add_subplot(111)

text1 = '1\n'.format(0)
text2 = '2\n'.format(0)
text3 = '3'.format(0)
text = text1 + text2 + text3

ob = offsetbox.AnchoredText(text, loc=2, prop=dict(size=30))
ax.add_artist(ob)

plt.show()
patches
import matplotlib.pyplot as plt
import matplotlib.patches as patches

circle = patches.CirclePolygon((0, 0), radius = 1, fc = 'b')
circle2 = patches.CirclePolygon((2, 0), radius = 1, fc = 'y')
circle3 = patches.CirclePolygon((4, 0), radius = 1, fc = 'r')
plt.gca().add_patch(circle)
plt.gca().add_patch(circle2)
plt.gca().add_patch(circle3)
plt.axis('scaled')
plt.show()
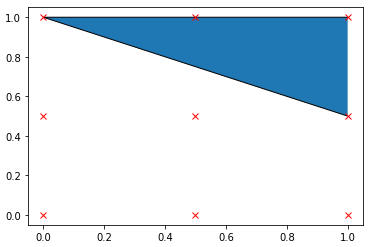
path
import matplotlib.pyplot as plt
from matplotlib.path import Path
import matplotlib.patches as mpatches
import numpy as np

fig = plt.figure()
ax = fig.add_subplot(111)

verts = [[0, 0], [0.5, 0], [1, 0], [0, 0.5], [0.5, 0.5], [1, 0.5] , [0, 1], [0.5, 1], [1, 1]]
codes = [1, 1, 1, 1, 1, 1, 2, 2, 2]

path = Path(verts, codes)
cleaned_path = path.cleaned(simplify=True)

patch = mpatches.PathPatch(cleaned_path)
plt.plot(np.asarray(verts)[:, 0], np.asarray(verts)[:, 1], "rx")

ax.add_patch(patch)
plt.show()
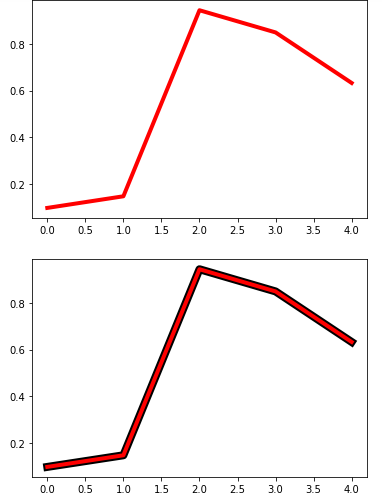
patheffects
import matplotlib.pyplot as plt
import matplotlib.patheffects as path_effects
import numpy as np

args = np.random.rand(5)
print (args)

# patheffects不使用
fig = plt.figure()
ax = fig.add_subplot(111)
ax.plot(args, linewidth=4, color='r')

# patheffects使用
fig2 = plt.figure()
ax2 = fig2.add_subplot(111)
ax2.plot(args, linewidth=4, color='r', path_effects=[
    path_effects.Stroke(linewidth=8, foreground='black'),
    path_effects.Normal()
    ])

plt.show()
pyplot
artist参照
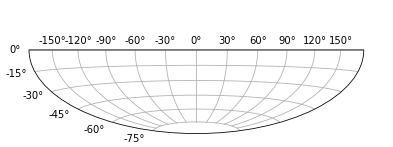
projections
import numpy as np
from matplotlib.projections.geo import HammerAxes
import matplotlib.projections as mprojections
from matplotlib.axes import Axes
from matplotlib.patches import Wedge
import matplotlib.spines as mspines

class LowerHammerAxes(HammerAxes):
    name = 'lower_hammer'
    def cla(self):
        HammerAxes.cla(self)
        Axes.set_xlim(self, -np.pi, np.pi)
        Axes.set_ylim(self, -np.pi / 2.0, 0)

    def _gen_axes_patch(self):
        return Wedge((0.5, 0.5), 0.5, 180, 360)

    def _gen_axes_spines(self):
        path = Wedge((0, 0), 1.0, 180, 360).get_path()
        spine = mspines.Spine(self, 'circle', path)
        spine.set_patch_circle((0.5, 0.5), 0.5)
        return {'wedge':spine}

mprojections.register_projection(LowerHammerAxes) # 投影クラス登録

#################
import matplotlib.pyplot as plt
fig = plt.figure()
ax = fig.add_subplot(111, projection='lower_hammer') # 登録した投影クラスを使用
ax.grid(True)
plt.show()
projections.polar
調査中
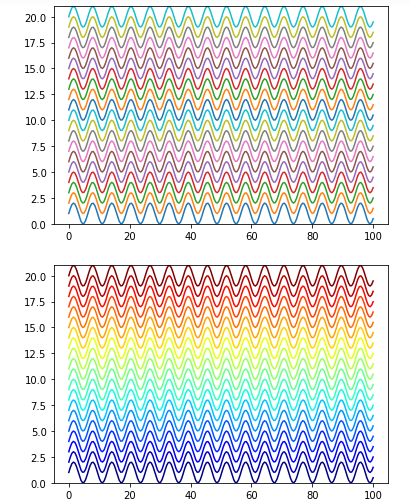
rcsetup
import matplotlib.pylab as plt
import matplotlib.rcsetup as rcsetup
import numpy as np

# rc設定カスタマイズ前
jet = plt.cm.jet
fig, ax = plt.subplots()
N = 20
idx = np.linspace(0, 1, N)
x = np.linspace(0, 100, 200)
for i in range(1, N+1):
    ax.plot(x, np.sin(x)+i)

ax.set_ylim(0, N+1)

# rc設定カスタマイズ後
fig2, ax2 = plt.subplots()
ax2.set_prop_cycle(rcsetup.cycler('color', jet(idx)))
for i in range(1, N+1):
    ax2.plot(x, np.sin(x)+i)

ax2.set_ylim(0, N+1)

plt.show()
sankey
import numpy as np
import matplotlib.pyplot as plt
from matplotlib.sankey import Sankey

fig = plt.figure(figsize=(10,10))
ax = fig.add_subplot(1, 1, 1, xticks=[], yticks=[],
                     title="Sanky Diagram")
sankey = Sankey(ax=ax, unit=None)
sankey.add(flows=[1.0, -0.3, -0.1, -0.1, -0.5],
           labels=['yamanote', 'keihinn', 'nannboku', 'syounann', ''],
           label='Tokyo Station',
           orientations=[0, -1, 1, 1, 0])
sankey.add(flows=[0.5, 0.1, 0.1, -0.1, -0.1, -0.1, -0.1, -0.3], fc='#37c959',
           label='Sinnzyuku Station',
           labels=['yamanote', 'hukutosinn', 'marunouchi', 'odakyuu', 'sinnzyuku','keiou', 'saikyou', 'chyuuou'],
           orientations=[0, -1, -1, 1, 1, -1, -1, 0], prior=0, connect=(4, 0))
diagrams = sankey.finish()
plt.legend(loc='upper center')
plt.axis('scaled')
plt.show()
scale
調査中
spines
projections参照
style
import numpy as np
from matplotlib import pyplot as plt
from matplotlib import style

arr = [0,1,2,3]
fig = plt.figure()
ax = fig.add_subplot(111)
style.use('ggplot')
ax.plot(arr)


import numpy as np
from matplotlib import pyplot as plt
from matplotlib import style
arr = [0,1,2,3]

fig = plt.figure()
ax = fig.add_subplot(111)
style.use('classic')
ax.plot(arr)
table
import matplotlib.pyplot as plt
import numpy as np
import pandas as pd
from matplotlib.table import Table

def checkerboard_table(data, fmt='{:.2f}', bkg_colors=['yellow', 'white']):
    fig = plt.figure()
    ax = fig.add_subplot(111)
    ax.set_axis_off()
    tb = Table(ax, bbox=[0,0,1,1])

    nrows, ncols = data.shape
    width, height = 1.0 / ncols, 1.0 / nrows

    # セル追加
    for (i,j), val in np.ndenumerate(data):
        idx = [j % 2, (j + 1) % 2][i % 2]
        color = bkg_colors[idx]

        tb.add_cell(i, j, width, height, text=fmt.format(val),
                    loc='center', facecolor=color)

    # 行ラベル
    for i, label in enumerate(data.index):
        tb.add_cell(i, -1, width, height, text=label, loc='right',
                    edgecolor='none', facecolor='none')
    # 列ラベル
    for j, label in enumerate(data.columns):
        tb.add_cell(-1, j, width, height/2, text=label, loc='center',
                           edgecolor='none', facecolor='none')
    ax.add_table(tb)
    return fig

# データ
df = pd.DataFrame(np.random.random((12,8)),
            columns=['A','B','C','D','E','F','G','H'])
checkerboard_table(df)
plt.show()
testing
調査中
text
import matplotlib.pyplot as plt
from matplotlib.text import Text

txt = Text(text='Text Display', x=0.4, y=0.5)

fig, ax = plt.subplots()
ax._set_artist_props(txt)
ax.texts.append(txt)

print(ax.texts)
plt.show()
textpath
import matplotlib.pyplot as plt
from matplotlib.textpath import TextPath
from matplotlib.patches import PathPatch

plt.plot((0, 0, 1, 1, 0), (1, 0, 0, 1, 1),color="gray")

tp = TextPath((0,0), "TextPath", size=0.2)
plt.gca().add_patch(PathPatch(tp, color="blue"))

plt.show()
ticker
artist参照
tight_layout
import matplotlib.pyplot as plt
import itertools
import warnings

fontsizes = itertools.cycle([8, 16, 24, 32])

def example_plot(ax):
    ax.plot([1, 2])
    ax.set_xlabel('x-label', fontsize=next(fontsizes))
    ax.set_ylabel('y-label', fontsize=next(fontsizes))
    ax.set_title('Title', fontsize=next(fontsizes))

fig, ((ax1, ax2), (ax3, ax4)) = plt.subplots(nrows=2, ncols=2)
example_plot(ax1)
example_plot(ax2)
example_plot(ax3)
example_plot(ax4)
# 重ならないよう、自動調整してくれる
plt.tight_layout()
transforms
import matplotlib.transforms as transforms
import matplotlib.pyplot as plt

fig = plt.figure()
ax = fig.add_subplot(111)

trans = transforms.blended_transform_factory(
    ax.transData, ax.transAxes)

ax.plot(range(50))
ax.axvline(20)

ax.text(20, 0.15, 'test', transform=trans, rotation='vertical', ha='right')
tri
import matplotlib.tri as tri
import matplotlib.pyplot as plt

# x=(0,1,2,0,1,2)
# y=(0,0,0,0,1,0)
x=(0,1,2,0,1,2,0,1,2,0,1,2,0,1,2)
y=(0,0,0,1,1,1,2,2,2,3,3,3,4,4,4)

triang = tri.Triangulation(x, y)
plt.triplot(triang)
plt.show()
type1font
調査中
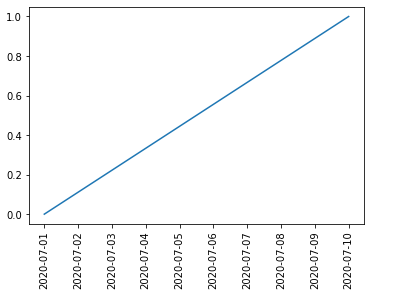
units
import matplotlib.pyplot as plt
import matplotlib.units, matplotlib.dates
import datetime

# カスタムクラス
class CostomClass(datetime.datetime):
   def date_format(self):
     return '{1:02d}{2:02d}{3:02d}'.format(self.year, self.month, self.day)

matplotlib.units.registry[CostomClass] = matplotlib.dates.DateConverter()

# オリンピック開催期間
x = [CostomClass(2020, 7, 1), CostomClass(2020, 7, 10)]
y = [0, 1]
plt.xticks(rotation = 90)
plt.plot(x, y)
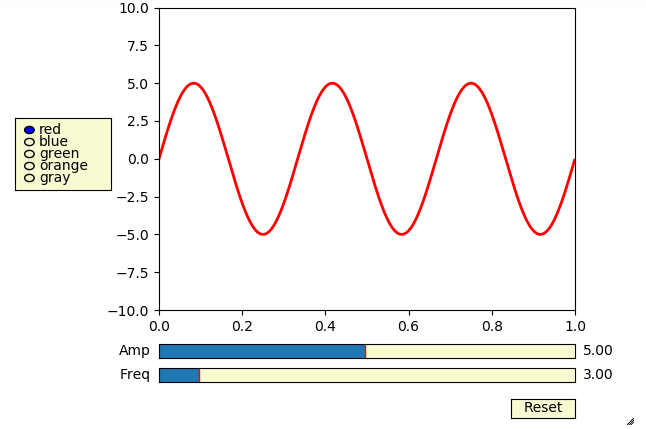
widgets
ラジオボタン等のクリック動作
%matplotlib nbagg

import numpy as np
import matplotlib.pyplot as plt
from matplotlib.widgets import Slider, Button, RadioButtons
class widgets_sample(object):
    def __init__(self):

        self.fig, ax = plt.subplots()
        plt.subplots_adjust(left=0.25, bottom=0.25)
        self.t = np.arange(0.0, 1.0, 0.001)
        a0 = 5
        f0 = 3
        s = a0*np.sin(2*np.pi*f0*self.t)
        self.l, = plt.plot(self.t, s, lw=2, color='red')
        plt.axis([0, 1, -10, 10])

        axcolor = 'lightgoldenrodyellow'
        axfreq = plt.axes([0.25, 0.1, 0.65, 0.03], facecolor=axcolor)
        axamp = plt.axes([0.25, 0.15, 0.65, 0.03], facecolor=axcolor)

        self.sfreq = Slider(axfreq, 'Freq', 0.1, 30.0, valinit=f0)
        self.samp = Slider(axamp, 'Amp', 0.1, 10.0, valinit=a0)
        self.sfreq.on_changed(self.update)
        self.samp.on_changed(self.update)

        resetax = plt.axes([0.8, 0.025, 0.1, 0.04])
        self.button = Button(resetax, 'Reset', color=axcolor, hovercolor='0.975')
        self.button.on_clicked(self.reset)

        rax = plt.axes([0.025, 0.5, 0.15, 0.15], facecolor=axcolor)
        self.radio = RadioButtons(rax, ('red', 'blue', 'green', 'orange', 'gray'), active=0)
        self.radio.on_clicked(self.colorfunc)

        plt.show()

    def update(self,val):
        amp = self.samp.val
        freq = self.sfreq.val
        self.l.set_ydata(amp*np.sin(2*np.pi*freq*self.t))
        self.fig.canvas.draw_idle()

    def reset(self, event):
        self.sfreq.reset()
        self.samp.reset()

    def colorfunc(self, label):
        self.l.set_color(label)
        self.fig.canvas.draw_idle()

widgets_sample()
参考
https://ja.stackoverflow.com/
https://matplotlib.org/index.html
https://code.i-harness.com/ja-jp/docs/matplotlib~3.0/sankey_api
