http://www.graphviz.org/Home.php
DOT言語でグラフを記述して、レンダリングできる。
グラフでなくても、ちょっとした図を描くときに便利。
digraph G {
	a -> b -> c;
	b -> d;
}
コマンド
インストール
macだったのでHomeBrewでインストールできた。
brew install graphviz
画像に変換
gccでC言語のソースをコンパイルするような感じ
# hoge.dotをhoge.pngに変換して開く
dot -Tpng hoge.dot -o hoge.png && open hoge.png
DOT言語
http://www.graphviz.org/doc/info/attrs.html#k:style
とりあえず簡単な使い方だけメモ。;や,をどこに入れるべきなのかよくわかってないが、適当に書いても案外コンパイルできる。
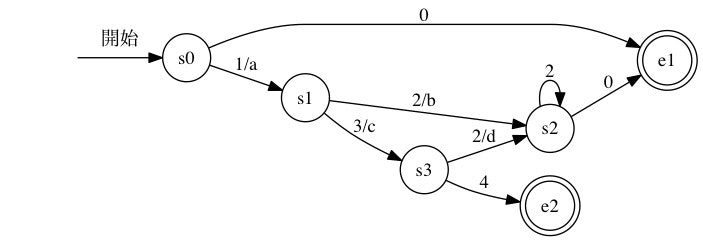
例:オートマトン
http://www.graphviz.org/doc/info/shapes.html
こういうのはレイアウトを気にせず簡単に書ける。むき出しで書いても良いが、引用符で囲んどいたほうが安全。
digraph G {
	rankdir=LR;
	empty [label = "" shape = plaintext];
	node [shape = doublecircle]; e1 e2;
	node [shape = circle];
	empty -> s0 [label = "開始"];
	s0 -> s1 [label = "1/a"];
	s0 -> e1 [label = "0"];
	s1 -> s2 [label = "2/b"];
	s1 -> s3 [label = "3/c"];
	s3 -> s2 [label = "2/d"];
	s3 -> e2 [label = "4"];
	s2 -> e1 [label = "0"];
	s2 -> s2 [label = "2"];
}
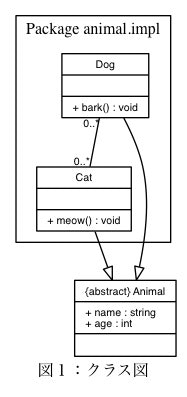
例:クラス図
頑張ればUMLも記述できるが、さすがにしんどい。
digraph G {
	label = "図1:クラス図"
	fontsize = 12

	node [fontname = "Bitstream Vera Sans", fontsize = 8, shape = "record"]
	edge [fontname = "Bitstream Vera Sans", fontsize = 8]

	Animal [ label = "{\{abstract\} Animal|+ name : string\l+ age : int\l|\l}"]

	subgraph cluster_Animal {
		label = "Package animal.impl"

		Dog [label = "{Dog||+ bark() : void\l}"]
		Cat [label = "{Cat||+ meow() : void\l}"]
	}

	edge [arrowhead = "empty"]
	Dog -> Animal
	Cat -> Animal

	edge [arrowhead = "none", headlabel = "0..*", taillabel = "0..*"]
	Dog -> Cat
}
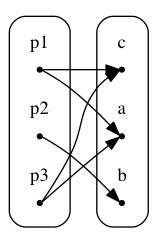
例:2部グラフ
はじめに(サブ)グラフとノードの設定をする。
ノードのshapeをpointにするとラベル名が表示されないので、
サブグラフのshapeをplaintextにしてラベルを付け包んで点を表現してみた。
もっと簡単な書き方があるかも知れない。
digraph G {
	graph [style=rounded color=black shape=plaintext rankdir=LR];
	node [shape=point];

	subgraph cluster_source {
		subgraph cluster_p1 {
			label="p1" color=white shape=plaintext;
			p1
		}
		subgraph cluster_p2 {
			label="p2" color=white shape=plaintext;
			p2
		}
		subgraph cluster_p3 {
			label="p3" color=white shape=plaintext;
			p3
		}
	}

	subgraph cluster_sink {
		subgraph cluster_a {
			label="a" color=white shape=plaintext;
			a
		}
		subgraph cluster_b {
			label="b" color=white shape=plaintext;
			b
		}
		subgraph cluster_c {
			label="c" color=white shape=plaintext;
			c
		}
	}

	p1 -> a p1 -> c
	p2 -> b
	p3 -> c p3 -> a
}


