MYJLab Advent Calendar 2020 22日目の記事です。
responderの記事を書くつもりだったのですが、時間がなかったので断念...
以前Twitchのコメントを取得してゴニョゴニョしたことがあったので、それを記事にしました。
やること
- Twitchの配信アーカイブのコメントを取得し、csvファイルへ出力する。
- Matplotlibを使ってコメントの流量を可視化する。
準備
実行環境
Python 3.7.9
Jupyter Notebook
Twitch API
Twitch Developersでclient-idを取得します。
実装
配信アーカイブのコメントを取得
Twitchの配信アーカイブからコメントを取得し、csvファイルへ出力します。
今回はstylishnoobさんの配信アーカイブからコメントを取得しました。
get_comments.py
import requests
import json
import csv

client_id = 'your client-id'
video_id = '841484712'

# 一回目のリクエスト
url = 'https://api.twitch.tv/v5/videos/' + video_id + '/comments?content_offset_seconds=0'
headers = {'client-id': client_id}
r = requests.get(url, headers=headers)
row_data = r.json()

with open('comments.csv', 'a') as f:
    writer = csv.writer(f)
    for comment in row_data['comments']:
        writer.writerow([
            comment['content_offset_seconds'],
            comment['message']['body']
        ])

# 二回目以降のリクエスト
while '_next' in row_data:
    url = 'https://api.twitch.tv/v5/videos/' + video_id + '/comments?cursor=' + row_data['_next']
    headers = {'client-id': client_id}
    r = requests.get(url, headers=headers)
    row_data = r.json()

    with open('comments.csv', 'a') as f:
        writer = csv.writer(f)
        for comment in row_data['comments']:
            writer.writerow([
                comment['content_offset_seconds'],
                comment['message']['body']
            ])
生成されたcsvファイル(一部)
comments.csv
commented_sec,comment
1.37,OhMyDog OhMyDog
5.502,sekiKansya
7.952,sekiKansya sekiKansya sekiKansya
10.084,sekiKansya sekiKansya sekiKansya
11.785,sekiOct sekiOct sekiOct
13.287,せきさああああああああああん
13.481,sekiKansya sekiKansya sekiKansya
13.527,sekiKansya sekiKansya sekiKansya
14.75,OhMyDog OhMyDog OhMyDog
14.983,感謝します
コメントの流量を可視化
Matplotlibを使いコメントの流量を可視化します。1分毎のコメント数をグラフで表示します。
ここからはJupyter Notebookで実行します。
まず、必要なライブラリをimportし、先ほど生成したcsvファイルを読み込みます。
import pandas as pd
import matplotlib.pyplot as plt
from IPython.display import display

df = pd.read_csv('comments.csv')
次にデータを加工します。
# コメント投稿時間の単位を、秒から分に直す
df['commented_min'] = df['commented_sec'] // 60
df['commented_min']  = df['commented_min'] .astype(int)
最後にグラフを作成します。
# 最後のコメントが投稿された時間(分)
last_commented_minutes = df.iat[-1, 2]

# グラフの個数は、last_commented_minutesを使い動的に指定。60分ごとにグラフを1つ作成
graph_number = last_commented_minutes // 60  + 1

# figsizeはgraph_numberを使い動的に指定。グラフ1つあたり(20,7)を割り当てる。
fig, ax = plt.subplots(graph_number, 1, figsize=(20,  graph_number * 7))

for first_index in range(0, last_commented_minutes + 1, 60):
    # コメントが投稿された時間(分刻み)
    x = df.groupby('commented_min').count().iloc[first_index : first_index + 60].index

    # 1分間あたりのコメント数のグラフ
    ax[(first_index + 1) // 60].plot(x, df.groupby('commented_min').count().iloc[first_index : first_index + 60].comment.values, marker=".", label='the number of comments')

    ax[(first_index + 1) // 60].grid(axis='both')
    ax[(first_index + 1) // 60].set_xlim(first_index, first_index + 60)
    ax[(first_index + 1) // 60].legend()
plt.show()
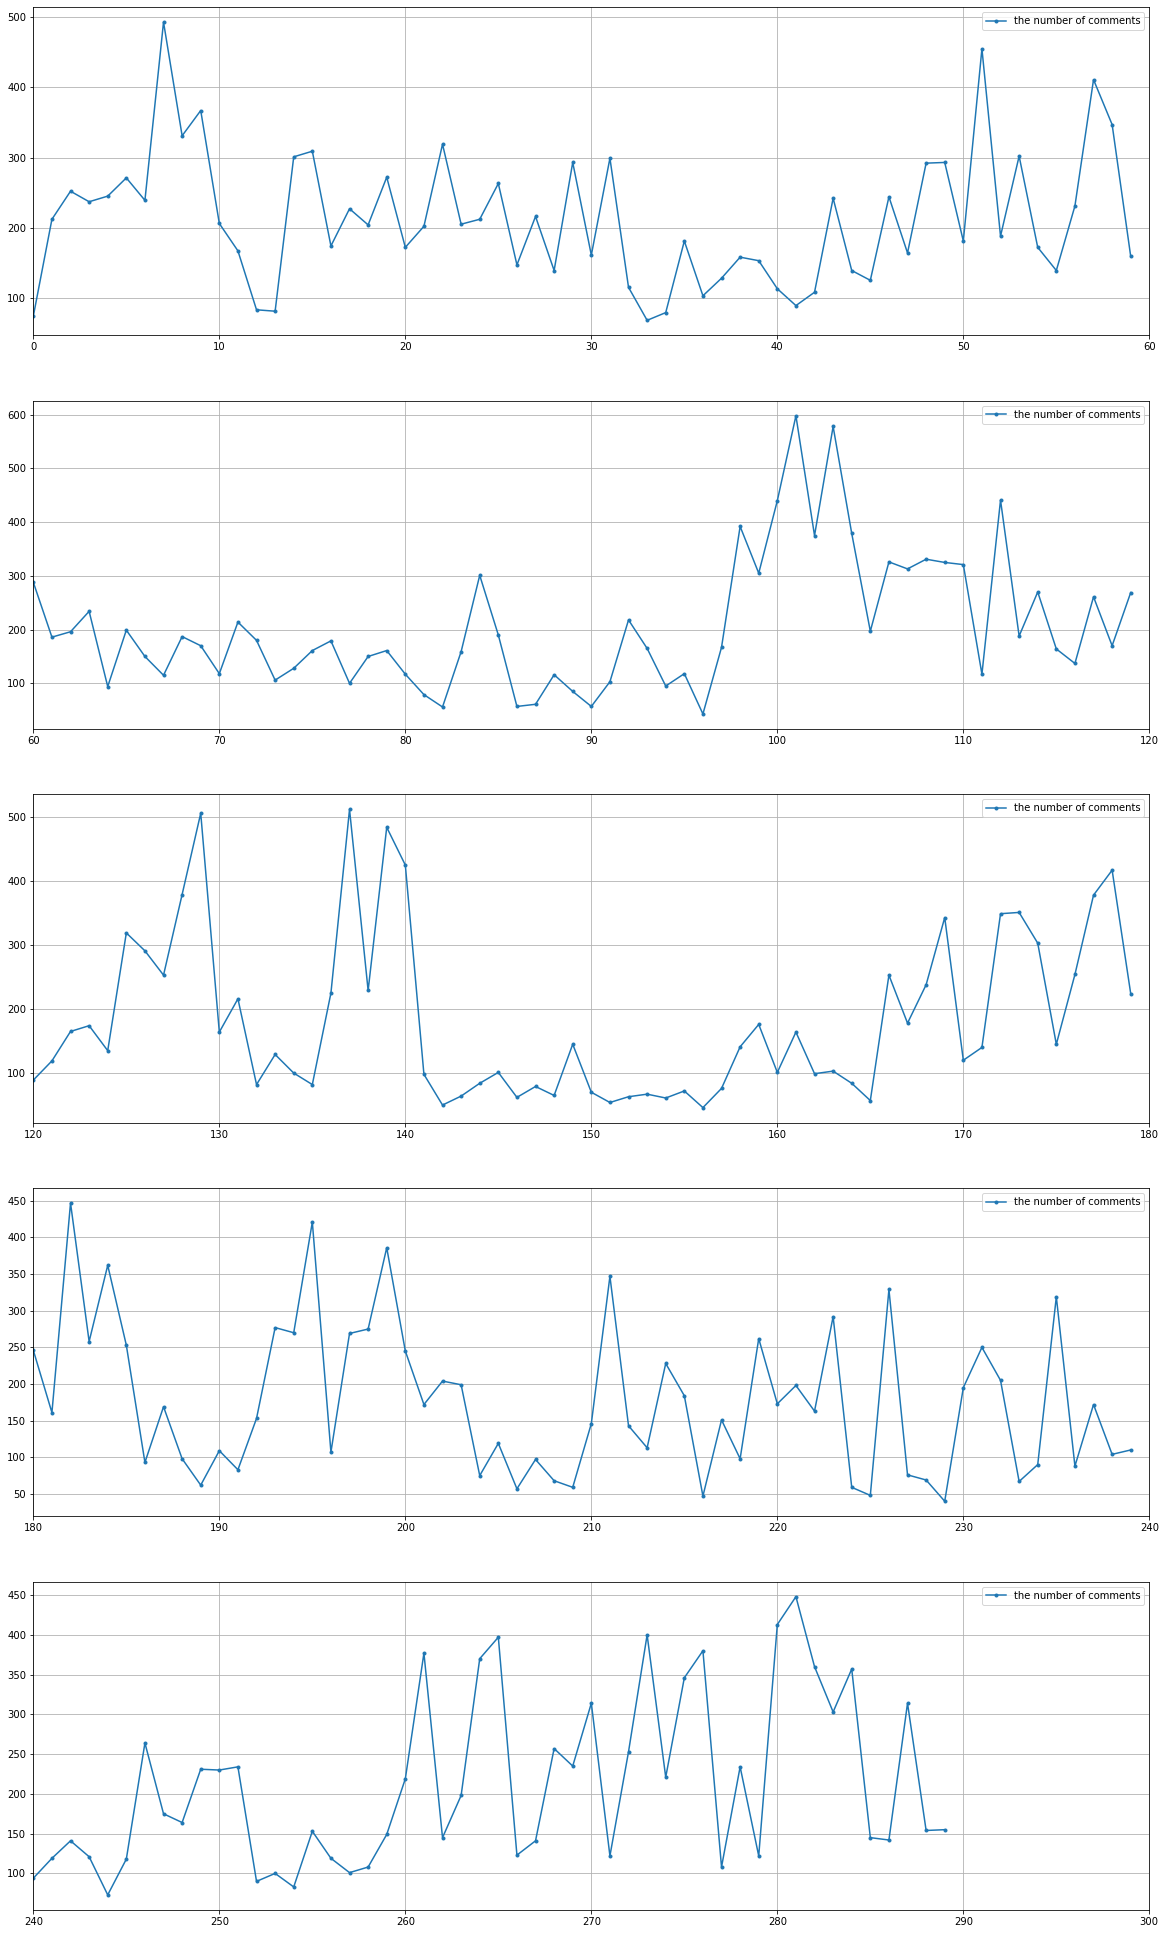
青色の折れ線が、1分毎のコメント数を示しています。
コメント流量は時間によってかなり変動しているのがわかります。
大雑把ではありますが、配信の盛り上がりポイントを把握できるのではないでしょうか。