主成分分析
- 多変量データをより少数個の指標にまとめる.
- 学習データの分散が最大になる方向への線形変換を求める手法.
- 情報の損失はなるべく小さくする.
- 少数変数にすることによって可視化が可能になる(100次元→2,3次元).
- 学習データの分散が最大になる方向への線形変換を求める手法.
数式化
- 学習データ
$$\boldsymbol{x} = (x_1,x_2,\cdots,x_m)^T \in \mathbb{R}^m$$ - 平均ベクトル
$$\bar{\boldsymbol{x}} = \frac{1}{n} \sum_{i=1}^{n}\boldsymbol{x}_i$$ - データ行列を平均ベクトルとの差分で作成
$$\bar{\boldsymbol{X}}=(\boldsymbol{x}_1-\bar{\boldsymbol{x}},\cdots,\boldsymbol{x}_n-\bar{\boldsymbol{x}})^T$$ - $n$個のデータを係数ベクトルを用いて線形変換する.
$$ \boldsymbol{s}_j = (s_{1j},\cdots,s_{nj})^T = \bar{\boldsymbol{X}}\boldsymbol{a}_j $$
変換後の分散が最大となる射影軸(線形変換)を探索する.
変換後の分散は,下記の通りで,これを最大化する係数ベクトル$\boldsymbol{a}_j$を求める.
\begin{align}
Var(\boldsymbol{s}_j) &= \frac{1}{n}\boldsymbol{s}_j^T\boldsymbol{s}_j \\
&= \frac{1}{n}(\bar{\boldsymbol{X}}\boldsymbol{a}_j)^T(\bar{\boldsymbol{X}}\boldsymbol{a}_j)\\
&= \frac{1}{n}\boldsymbol{a}_j^T\bar{\boldsymbol{X}}^T\bar{\boldsymbol{X}}\boldsymbol{a}_j\\
&= \boldsymbol{a}_j^T Var(\bar{\boldsymbol{X}})\boldsymbol{a}_j\\
\end{align}
ノルムに制約を入れないと無限に解があるので,ノルムに制約を入れる.
\arg \max_{{a}\in \mathbb{R}^m}\boldsymbol{a}_j^T Var(\bar{\boldsymbol{X}})\boldsymbol{a}_j \hspace{10pt} s.t. \hspace{5pt}\boldsymbol{a}_j^T \boldsymbol{a}_j=1
- 上記の制約付き最適化問題はラグランジュ関数を最大にする係数ベクトルを見つければ良い.
- 係数ベクトルで微分して$0$と置き解を求める.
- 分散共分散行列の固有ベクトルが解となる.→固有値問題に帰着する.
- ラグランジュ関数
$$E(\boldsymbol{a}_j)=\boldsymbol{a}_j^T Var(\bar{\boldsymbol{X}})\boldsymbol{a}_j -\lambda(\boldsymbol{a}_j^T \boldsymbol{a}_j-1)$$
$$\frac{\partial E(\boldsymbol{a}_j)}{\partial\boldsymbol{a}_j} = 2Var (\bar{\boldsymbol{X}}) \boldsymbol{a}_j-2\lambda\boldsymbol{a}_j=0$$$$\Leftrightarrow Var(\bar{\boldsymbol{X}}) \boldsymbol{a}_j = \lambda \boldsymbol{a}_j$$
分散の値は固有値と一致する
$$Var(\boldsymbol{s}_1)=\boldsymbol{a}_j^T Var(\bar{\boldsymbol{X}})\boldsymbol{a}_j = \lambda_1\boldsymbol{a}_j^T \boldsymbol{a}_j=\lambda_1 $$
分散共分散行列は実対象行列なので,固有ベクトルはすべて直行する.
- 主成分
- 最大固有値に対応する固有ベクトルで線形変換された特徴量を第一主成分と呼ぶ.
- $k$番目の固有値に対応する固有ベクトルで変換された特徴量を第$k$主成分と呼ぶ
- 寄与率
- $k$番目の分散の全分散に対する割合を第$k$主成分の寄与率という.
ハンズオン
# https://ohke.hateblo.jp/entry/2017/08/11/230000を参考に利用しています。
import pandas as pd
from sklearn.model_selection import train_test_split
from sklearn.preprocessing import StandardScaler
from sklearn.linear_model import LogisticRegressionCV
from sklearn.metrics import confusion_matrix
from sklearn.decomposition import PCA
import matplotlib.pyplot as plt
%matplotlib inline
cancer_df = pd.read_csv('../data/cancer.csv')
print('cancer df shape: {}'.format(cancer_df.shape))
cancer df shape: (569, 33)
cancer_df
| id | diagnosis | radius_mean | texture_mean | perimeter_mean | area_mean | smoothness_mean | compactness_mean | concavity_mean | concave points_mean | ... | texture_worst | perimeter_worst | area_worst | smoothness_worst | compactness_worst | concavity_worst | concave points_worst | symmetry_worst | fractal_dimension_worst | Unnamed: 32 | |
|---|---|---|---|---|---|---|---|---|---|---|---|---|---|---|---|---|---|---|---|---|---|
| 0 | 842302 | M | 17.990 | 10.38 | 122.80 | 1001.0 | 0.11840 | 0.27760 | 0.300100 | 0.147100 | ... | 17.33 | 184.60 | 2019.0 | 0.16220 | 0.66560 | 0.71190 | 0.26540 | 0.4601 | 0.11890 | NaN |
| 1 | 842517 | M | 20.570 | 17.77 | 132.90 | 1326.0 | 0.08474 | 0.07864 | 0.086900 | 0.070170 | ... | 23.41 | 158.80 | 1956.0 | 0.12380 | 0.18660 | 0.24160 | 0.18600 | 0.2750 | 0.08902 | NaN |
| 2 | 84300903 | M | 19.690 | 21.25 | 130.00 | 1203.0 | 0.10960 | 0.15990 | 0.197400 | 0.127900 | ... | 25.53 | 152.50 | 1709.0 | 0.14440 | 0.42450 | 0.45040 | 0.24300 | 0.3613 | 0.08758 | NaN |
569 rows × 33 columns
cancer_df.drop('Unnamed: 32', axis=1, inplace=True)
cancer_df
| id | diagnosis | radius_mean | texture_mean | perimeter_mean | area_mean | smoothness_mean | compactness_mean | concavity_mean | concave points_mean | ... | radius_worst | texture_worst | perimeter_worst | area_worst | smoothness_worst | compactness_worst | concavity_worst | concave points_worst | symmetry_worst | fractal_dimension_worst | |
|---|---|---|---|---|---|---|---|---|---|---|---|---|---|---|---|---|---|---|---|---|---|
| 0 | 842302 | M | 17.990 | 10.38 | 122.80 | 1001.0 | 0.11840 | 0.27760 | 0.300100 | 0.147100 | ... | 25.380 | 17.33 | 184.60 | 2019.0 | 0.16220 | 0.66560 | 0.71190 | 0.26540 | 0.4601 | 0.11890 |
| 1 | 842517 | M | 20.570 | 17.77 | 132.90 | 1326.0 | 0.08474 | 0.07864 | 0.086900 | 0.070170 | ... | 24.990 | 23.41 | 158.80 | 1956.0 | 0.12380 | 0.18660 | 0.24160 | 0.18600 | 0.2750 | 0.08902 |
| 2 | 84300903 | M | 19.690 | 21.25 | 130.00 | 1203.0 | 0.10960 | 0.15990 | 0.197400 | 0.127900 | ... | 23.570 | 25.53 | 152.50 | 1709.0 | 0.14440 | 0.42450 | 0.45040 | 0.24300 | 0.3613 | 0.08758 |
569 rows × 32 columns
・diagnosis: 診断結果 (良性がB / 悪性がM)
・説明変数は3列以降、目的変数を2列目としロジスティック回帰で分類
# 目的変数の抽出
y = cancer_df.diagnosis.apply(lambda d: 1 if d == 'M' else 0)
# 説明変数の抽出
X = cancer_df.loc[:, 'radius_mean':]
# 学習用とテスト用でデータを分離
X_train, X_test, y_train, y_test = train_test_split(X, y, random_state=0)

# 標準化
scaler = StandardScaler()
X_train_scaled = scaler.fit_transform(X_train)
X_test_scaled = scaler.transform(X_test)

# ロジスティック回帰で学習
logistic = LogisticRegressionCV(cv=10, random_state=0,max_iter=100000) #Warning対策でmax_iterを設定
logistic.fit(X_train_scaled, y_train)

# 検証
print('Train score: {:.3f}'.format(logistic.score(X_train_scaled, y_train)))
print('Test score: {:.3f}'.format(logistic.score(X_test_scaled, y_test)))
print('Confustion matrix:\n{}'.format(confusion_matrix(y_true=y_test, y_pred=logistic.predict(X_test_scaled))))
Train score: 0.988
Test score: 0.972
Confustion matrix:
[[89  1]
 [ 3 50]]
・検証スコア97%で分類できることを確認
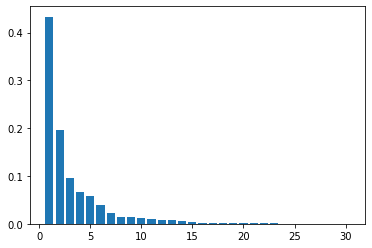
pca = PCA(n_components=30)
pca.fit(X_train_scaled)
plt.bar([n for n in range(1, len(pca.explained_variance_ratio_)+1)], pca.explained_variance_ratio_)
<BarContainer object of 30 artists>
# PCA
# 次元数2まで圧縮
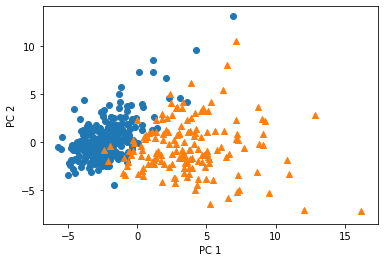
pca = PCA(n_components=2)
X_train_pca = pca.fit_transform(X_train_scaled)
print('X_train_pca shape: {}'.format(X_train_pca.shape))
# X_train_pca shape: (426, 2)

# 寄与率
print('explained variance ratio: {}'.format(pca.explained_variance_ratio_))
# explained variance ratio: [ 0.43315126  0.19586506]

# 散布図にプロット
temp = pd.DataFrame(X_train_pca)
temp['Outcome'] = y_train.values
b = temp[temp['Outcome'] == 0]
m = temp[temp['Outcome'] == 1]
plt.scatter(x=b[0], y=b[1], marker='o') # 良性は○でマーク
plt.scatter(x=m[0], y=m[1], marker='^') # 悪性は△でマーク
plt.xlabel('PC 1') # 第1主成分をx軸
plt.ylabel('PC 2') # 第2主成分をy軸
X_train_pca shape: (426, 2)
explained variance ratio: [0.43315126 0.19586506]


Text(0, 0.5, 'PC 2')
考察
- 第一主成分および第二,第三主成分により2〜3次元に落とすことで,グラフなどに可視化できるのば便利.
- さらに,ハンズオン内であるように寄与率を可視化することで,なぜその変数を選んだかの根拠を示せる.


