matplotlibでのプロットの基本
https://qiita.com/KntKnk0328/items/5ef40d9e77308dd0d0a4
sin.py
import matplotlib.pyplot as plt
import numpy as np

# データ生成
x = np.linspace(0, 10, 100)
y1 = np.sin(x)
y2 = np.cos(x)

# プロット領域(Figure, Axes)の初期化
fig = plt.figure(figsize=(12, 8))
ax1 = fig.add_subplot(131)
ax2 = fig.add_subplot(132)
ax3 = fig.add_subplot(133)

# 棒グラフの作成
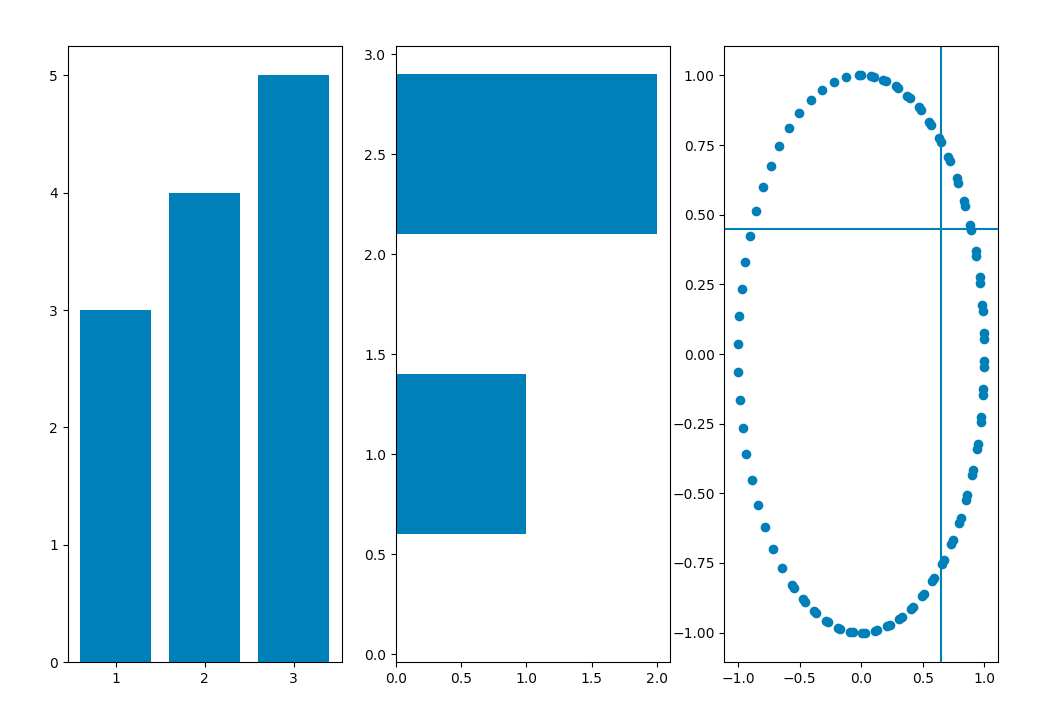
ax1.bar([1,2,3],[3,4,5])
ax2.barh([0.5,1,2.5],[0,1,2])
ax3.scatter(y1, y2)

# 水平線、垂直線を入れる
ax3.axhline(0.45)
ax3.axvline(0.65)

plt.show()
編集して実行してみる。
macOS
$ vi sin.py
$ python sin.py
Unable to revert mtime: /Library/Fonts
/Users/administrator/.pyenv/versions/anaconda3-4.3.0/lib/python3.6/site-packages/matplotlib/font_manager.py:280: UserWarning: Matplotlib is building the font cache using fc-list. This may take a moment.
  'Matplotlib is building the font cache using fc-list. '
けいこくは警告。
描画にすこし時間がかかった。
画像を閉じるとプログラムが終わった。再度実行した。
macOS
$ python sin.py
今度は警告が出なかった。さいしょだけなんだ。
参考資料
python error collection
文書履歴(document history)
ver. 0.01 初稿 20190717
ver. 0.01 初稿 20230311
最後までおよみいただきありがとうございました。
いいね 💚、フォローをお願いします。
Thank you very much for reading to the last sentence.
Please press the like icon 💚 and follow me for your happy life.
