初めに
matplotlibで図を描画する際に、二種類の手法が用いられている。
- figuresとaxisを作成し、それを元に描画用メソッドを呼び出す(Object-Oriented style, OOスタイル)
- pyplotに全てを任せ、図・軸の設定を行う(pyplotスタイル)
OO-style
import matplotlib.pyplot as plt
import numpy as np
x = np.linspace(0, 2, 100)

# Note that even in the OO-style, we use `.pyplot.figure` to create the figure.
fig, ax = plt.subplots()             # Create a figure and an axes.
ax.plot(x, x, label='linear')        # Plot some data on the axes.
ax.plot(x, x**2, label='quadratic')  # Plot more data on the axes...
ax.plot(x, x**3, label='cubic')      # ... and some more.
ax.set_xlabel('x label')             # Add an x-label to the axes.
ax.set_ylabel('y label')             # Add a y-label to the axes.
ax.set_title("Simple Plot")          # Add a title to the axes.
ax.legend()                          # Add a legend.
fig.show()
pyplot-style
import matplotlib.pyplot as plt
import numpy as np
x = np.linspace(0, 2, 100)

plt.plot(x, x, label='linear')  # Plot some data on the (implicit) axes.
plt.plot(x, x**2, label='quadratic')  # etc.
plt.plot(x, x**3, label='cubic')
plt.xlabel('x label')
plt.ylabel('y label')
plt.title("Simple Plot")
plt.legend()
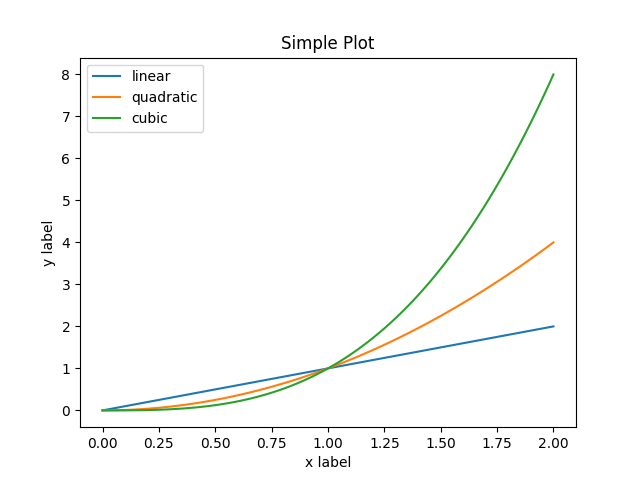
OOスタイルでもpyplotスタイルでも、下の図を描画することができる。
公式チュートリアルによると、
In general, we suggest to restrict pyplot to interactive plotting (e.g., in a Jupyter notebook), and to prefer the OO-style for non-interactive plotting (in functions and scripts that are intended to be reused as part of a larger project).
とあるので、ゴリゴリ研究をすすめるときには、スクリプトを書いてOOスタイルでやっていくのが推奨されているよう。以上で二種類の描画方法を示したので、以下では特にOOスタイルを扱う際のメモを書いていく。
OO-Styleによる描画
figure
fig = plt.figure()            # an empty figure with no Axes
fig, ax = plt.subplots()      # a figure with a single Axes
fig, axs = plt.subplots(2, 2) # a figure with a 2x2 grid of Axes
見た目調整
Tick
ax.tick_params(axis='x', labelsize)
余白
fig.subplots_adjust(left=0, right=1, bottom=0, top=1)
# 余白の量
# left   = 0 : 左の余白はなし
# bottom = 0 : 下の余白はなし
見た目調整(plt)
plt.xlabel(軸の名前)
plt.ylabel(軸の名前)
plt.xlim(下限, 上限)
plt.ylim(下限, 上限)
References
基本的に公式チュートリアルを元に自分が気になった部分をまとめましたので、随時参照してください。