はじめに
どうも、emonです。
今回は、react ❌ chartjsでグラフを表示させ更にグラフ上の点をドラッグし、値を変更させる方法について記載します。
必要ライブラリ
- chart.js
- react-chartjs
- chartjs-plugin-dragdata
reactとchartjsでグラフを表示させる
yarnでライブラリをインストールする場合
yarn add chart.js react-chartjs
npmでライブラリをインストールする場合
npm i chart.js react-chartjs
まず初めに表示させるグラフを適当に定義します。
今回は、折れ線グラフでやってみたいと思います。(全てを確認しておりませんが、棒グラフではできました)
App.jsx
import {
  Chart,
  registerables,
  CategoryScale,
  LinearScale,
  BarElement,
  Title,
  Tooltip,
  Legend,
} from 'chart.js';
import React, { useEffect } from 'react';
import { Line } from 'react-chartjs-2';
import { options } from './options';

function App() {
  Chart.register(...registerables,
    CategoryScale,
    LinearScale,
    BarElement,
    Title,
    Tooltip,
    Legend,
  );
  const width = 250;
  const height = 250;
  useEffect(() => {
    const canvasElement = document.createElement('canvas');
    canvasElement.width = width;
    canvasElement.height = height;
    const ctx = canvasElement.getContext('2d');

    // draw
    ctx.clearRect(0, 0, width, height);
    ctx.fillStyle = '#888888';
    ctx.fillRect(0, 0, width, height);
  }, []);

  return (
    <Line height={300} width={400} data={options.data} options={options.options}/>
  )
}

export default App;
options.js
// chartjsで表示させたい情報を定義
export const options = {
type: 'line',
data: {
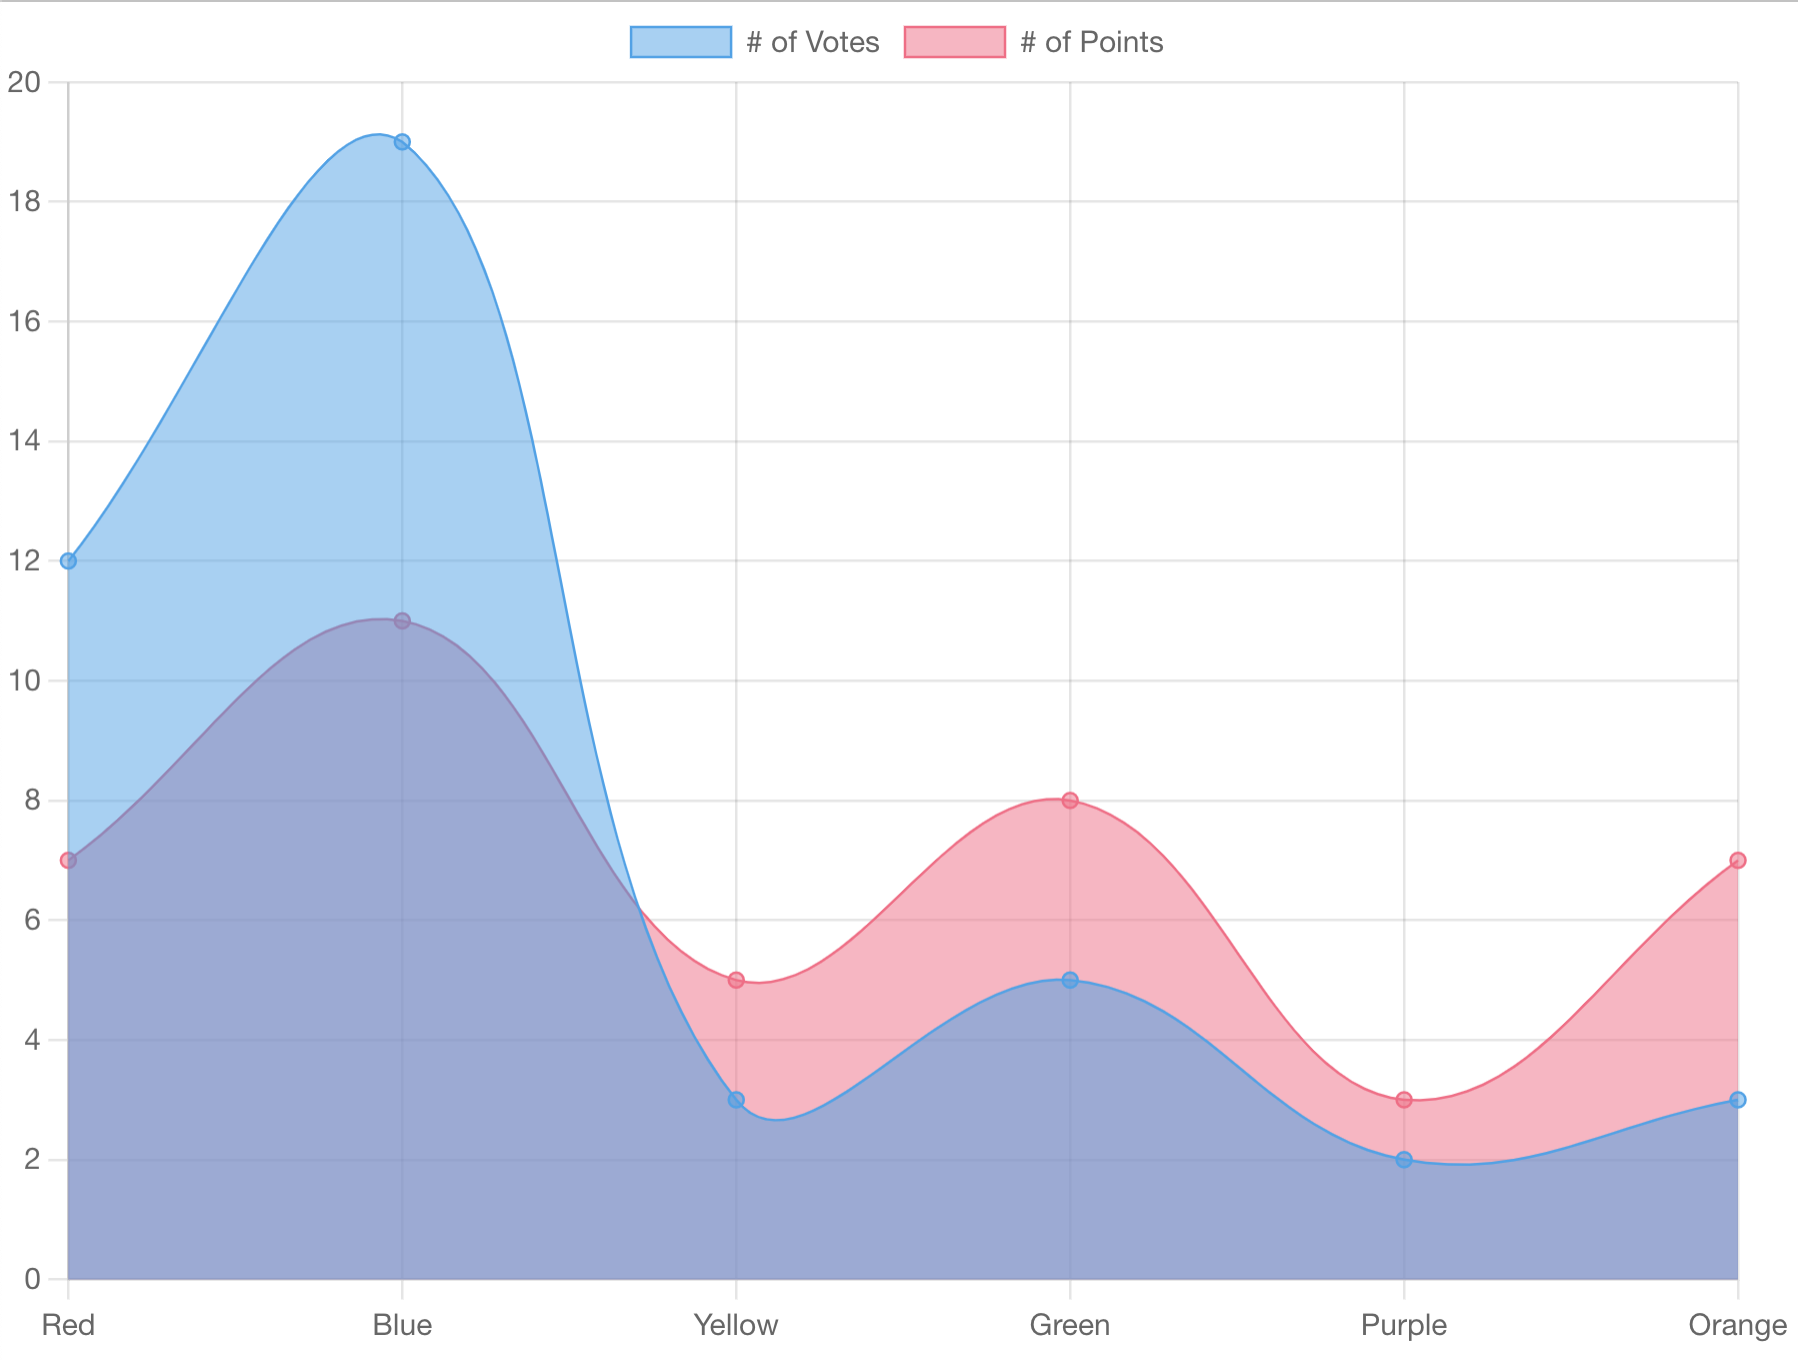
labels: ["Red", "Blue", "Yellow", "Green", "Purple", "Orange"],
datasets: [{
label: '# of Votes',
data: [12, 19, 3, 5, 2, 3],
fill: true,
tension: 0.4,
borderWidth: 1,
pointHitRadius: 25
},
{
label: '# of Points',
data: [7, 11, 5, 8, 3, 7],
fill: true,
tension: 0.4,
borderWidth: 1,
pointHitRadius: 25
}
]
},
options: {
scales: {
y: {
min: 0,
max: 20
}
},
}
}
アプリを立ち上げると以下のように表示されます。
グラフ上の点をドラッグして、値を変更させる
yarnでライブラリをインストールする場合
yarn add chartjs-plugin-dragdata
npmでライブラリをインストールする場合
npm i chartjs-plugin-dragdata
chartjs-plugin-dragdataのプラグインを使用できるように設定を追加する
:App.jsx
+ import chartjsPluginDragdata from 'chartjs-plugin-dragdata';
<省略>
  Chart.register(...registerables,
    CategoryScale,
    LinearScale,
    BarElement,
    Title,
    Tooltip,
    Legend,
+   chartjsPluginDragdata,
  );
Lineコンポーネントにoptionsのpropsを追加する
:App.jsx
- <Line height={300} width={400} data={options.data} options={options.options}/>
+ <Line height={300} width={400} data={options.data} options={options.options} plugins={[options.options.plugins]} />
optionsのoptionsに以下の機能を追加する
- hover時にカーソルを
grab状態にする - 点をドラッグする時などのカーソル状態を定義する
options.js
            onHover: function (e) {
                const point = e.chart.getElementsAtEventForMode(e, 'nearest', { intersect: true }, false)
                if (point.length) e.native.target.style.cursor = 'grab'
                else e.native.target.style.cursor = 'default'
            },
            plugins: {
                dragData: {
                    round: 1,
                    showTooltip: true,
                    onDragStart: function (e, datasetIndex, index, value) {
                        // console.log(e)
                    },
                    onDrag: function (e, datasetIndex, index, value) {
                        e.target.style.cursor = 'grabbing'
                        // console.log(e, datasetIndex, index, value)
                    },
                    onDragEnd: function (e, datasetIndex, index, value) {
                        e.target.style.cursor = 'default'
                        // console.log(datasetIndex, index, value)
                    },
                }
            }
上記追加後、アプリを立ち上げると以下のようにグラフ上の点をドラッグで変更することができます。
雑談
pythonだとmatplotlibで簡単にグラフ上の点をドラッグして変更することができますが、
javascriptだと意外にも実装例が少なかったので、備忘録兼少しでも多くの方の参考になればと思い投稿しました。では、また次回カバ。カーバー
参考