
注意 Expo 37からはfirebase analyticsが使用可能です。
実はExpo(react naitveアプリを作るフレームワーク)には標準でアナリティクスが付いている。
まず、Expoが公式で対応しているanalyticsサービスのAmplitudeにアカウントを作り、API keyをGetしましょう。(残念ながらExpoではfirebase analyticsを使えませんが、 fierbaseより、amplitudeのが使いやすいですよー)
Amplitude
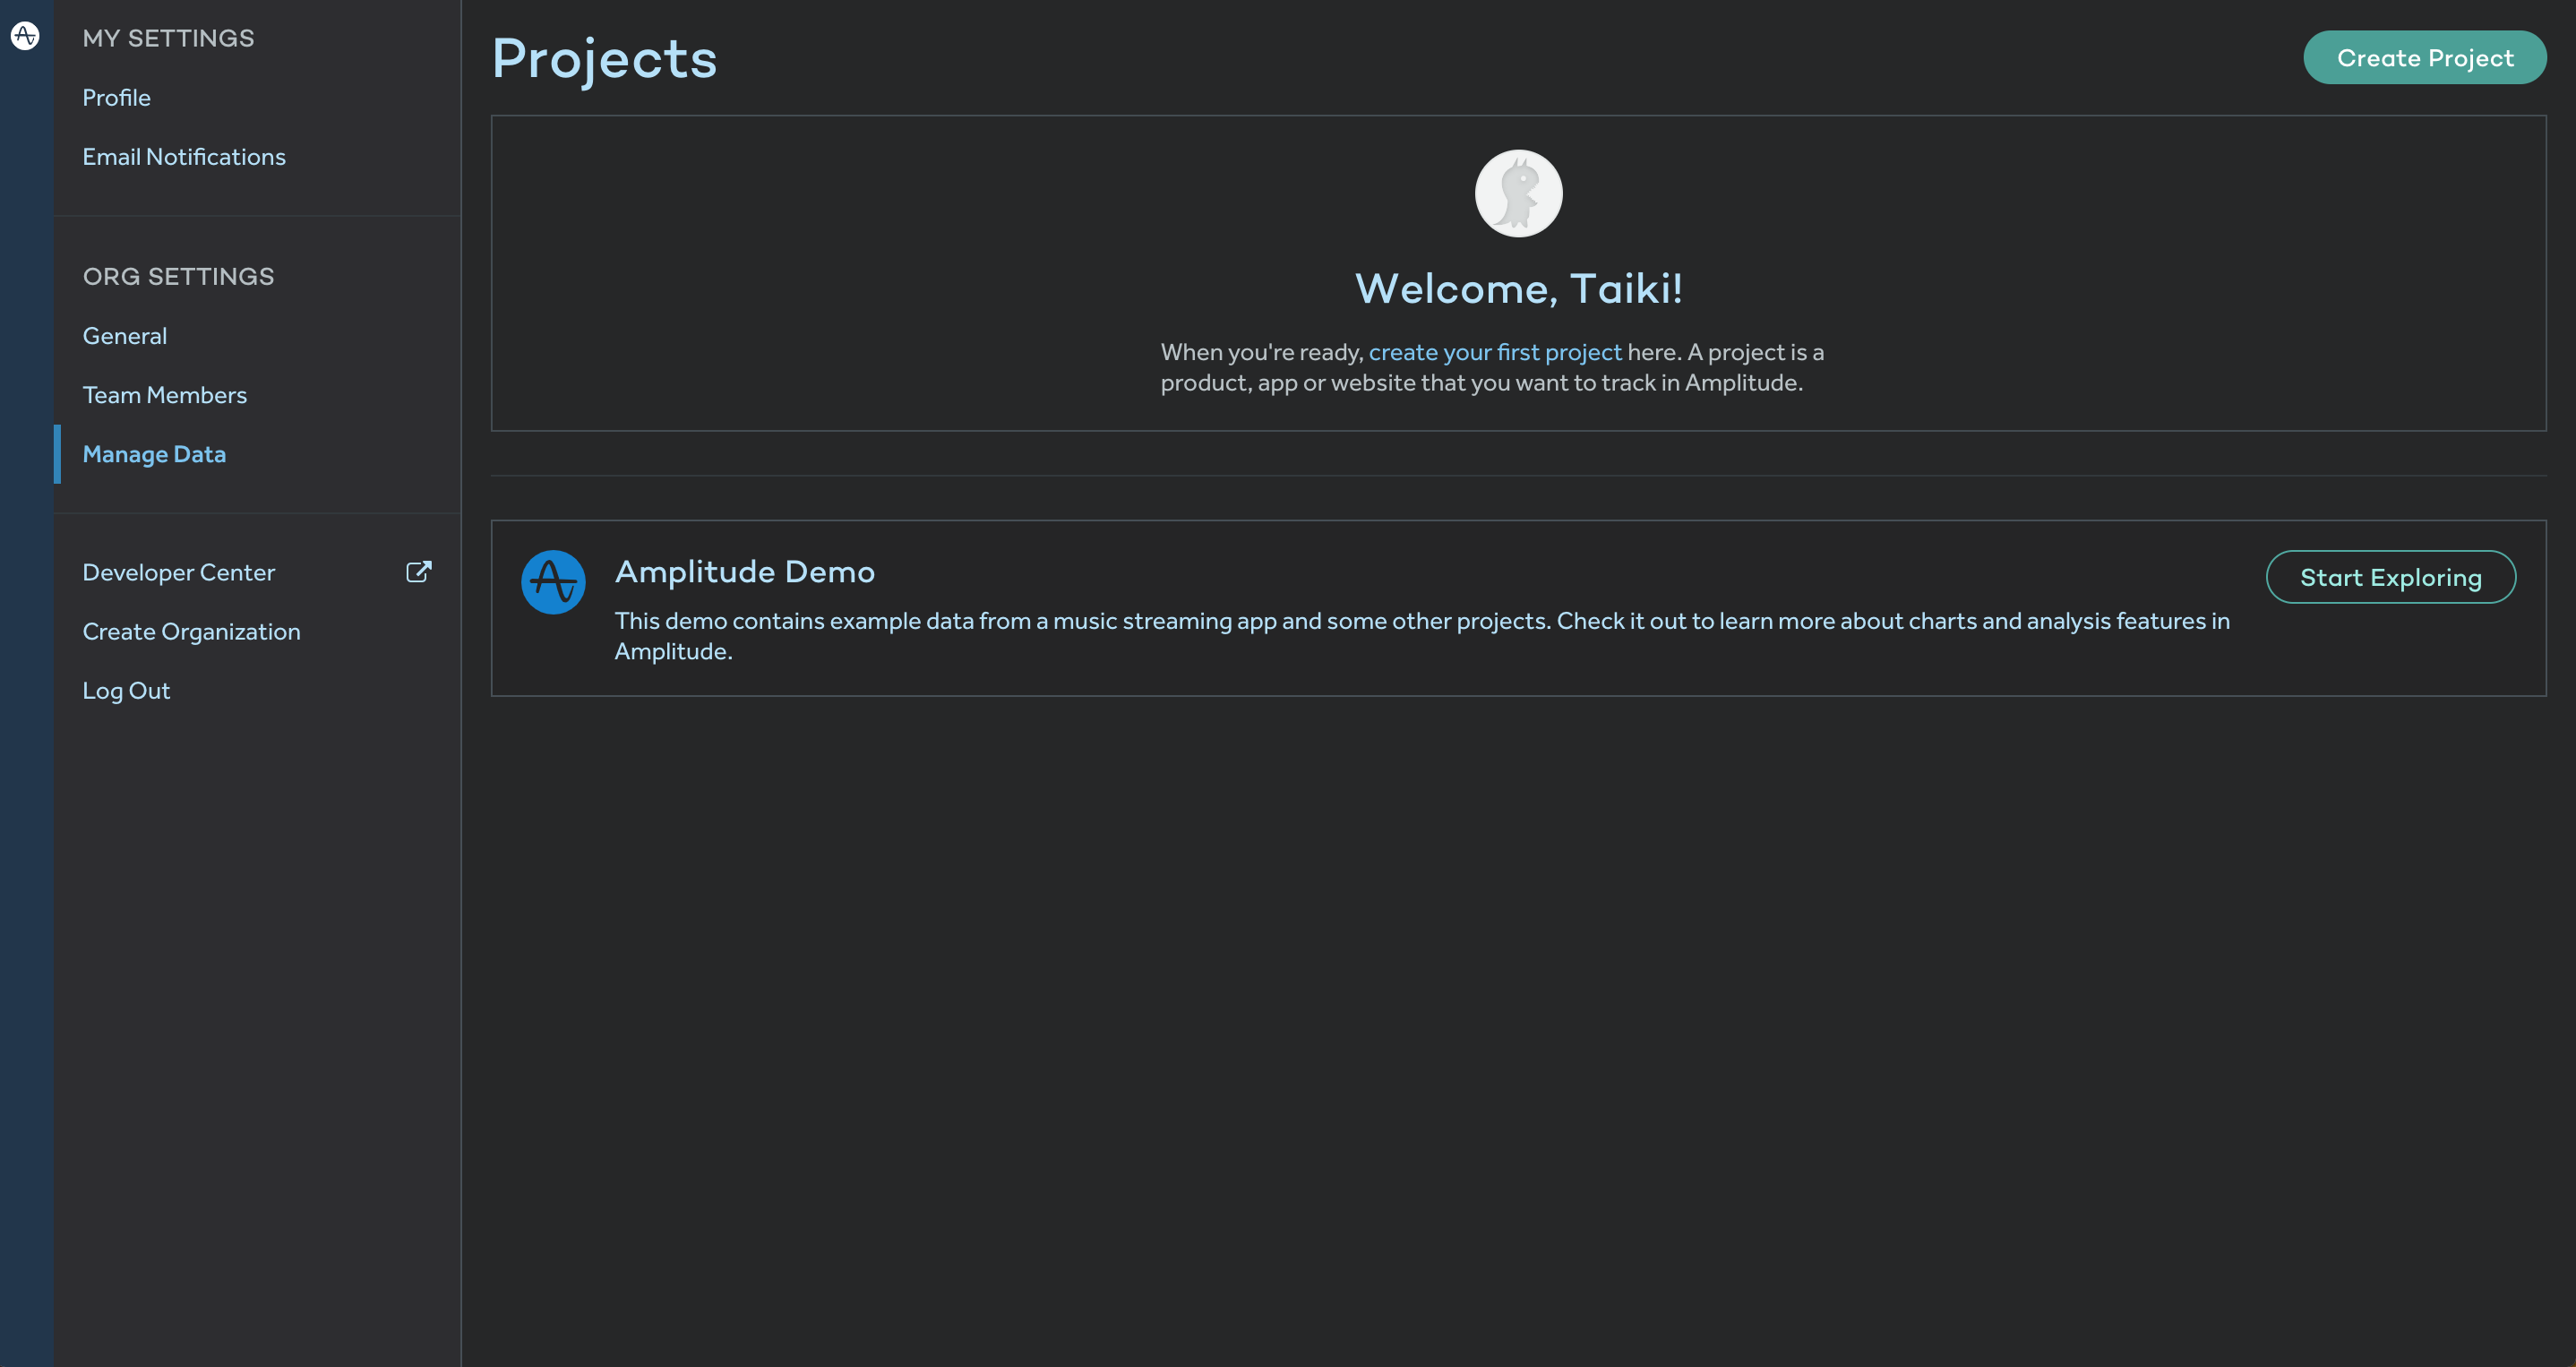
アカウントを作成すると以下の画面が出てくるので、右上の create projectをクリックして、projectを作成する。
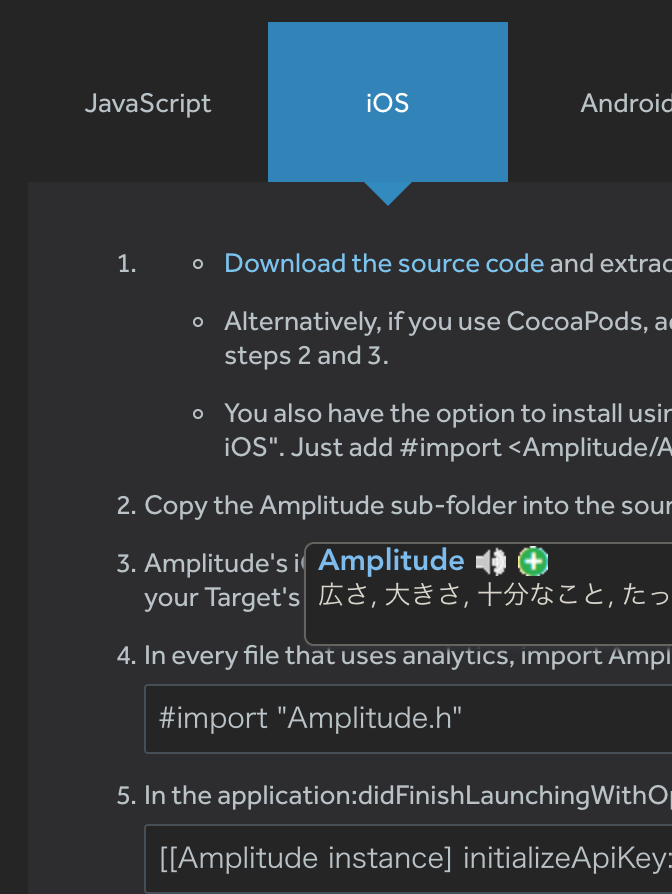
api keyはiosタブをクリックすると、ios用のapikeyが出てくるので、それをクリップボードにコピーしておこう。
Amplitudeというanalyticsサービスがexpoから標準提供されていて、コードで
import { Amplitude } from 'expo'
とするだけでanalyticsを始めることが出来る。
Let's コーディング
まず expoでプロジェクトを作成。
npm i -g expo
expo init AwesomeProject
cd AwesomeProject
npm i
次にanalytics用のファイルを作成
touch analytics.js
// analytics.js
import {Amplitude} from 'expo'

Amplitude.initialize("97f362XXXXXXXXXXXX")
Amplitude.logEvent("Hello World")
そしてanalytics.jsをApp.jsにimportする。
import React from 'react';
import { Platform, StatusBar, StyleSheet, View } from 'react-native';
import { AppLoading, Asset, Font, Icon } from 'expo';
import AppNavigator from './navigation/AppNavigator';
+ import analytics from './analytics'

export default class App extends React.Component {
  state = {
    isLoadingComplete: false,
  };

  render() {
    if (!this.state.isLoadingComplete && !this.props.skipLoadingScreen) {
      return (
        <AppLoading
          startAsync={this._loadResourcesAsync}
          onError={this._handleLoadingError}
          onFinish={this._handleFinishLoading}
        />
      );
    } else {
      return (
        <View style={styles.container}>
          {Platform.OS === 'ios' && <StatusBar barStyle="default" />}
          <AppNavigator />
        </View>
      );
    }
  }

  _loadResourcesAsync = async () => {
    return Promise.all([
      Asset.loadAsync([
        require('./assets/images/robot-dev.png'),
        require('./assets/images/robot-prod.png'),
      ]),
      Font.loadAsync({
        // This is the font that we are using for our tab bar
        ...Icon.Ionicons.font,
        // We include SpaceMono because we use it in HomeScreen.js. Feel free
        // to remove this if you are not using it in your app
        'space-mono': require('./assets/fonts/SpaceMono-Regular.ttf'),
      }),
    ]);
  };

  _handleLoadingError = error => {
    // In this case, you might want to report the error to your error
    // reporting service, for example Sentry
    console.warn(error);
  };

  _handleFinishLoading = () => {
    this.setState({ isLoadingComplete: true });
  };
}

const styles = StyleSheet.create({
  container: {
    flex: 1,
    backgroundColor: '#fff',
  },
});
シュミレータを立ち上げてからAmptitudeに行ってみる。
expo start
expo ios
シュミレータを立ち上げる前は以下のような画面が出ているはずだ。

シュミレータを立ち上げてから数分経つと、

やったぜ!
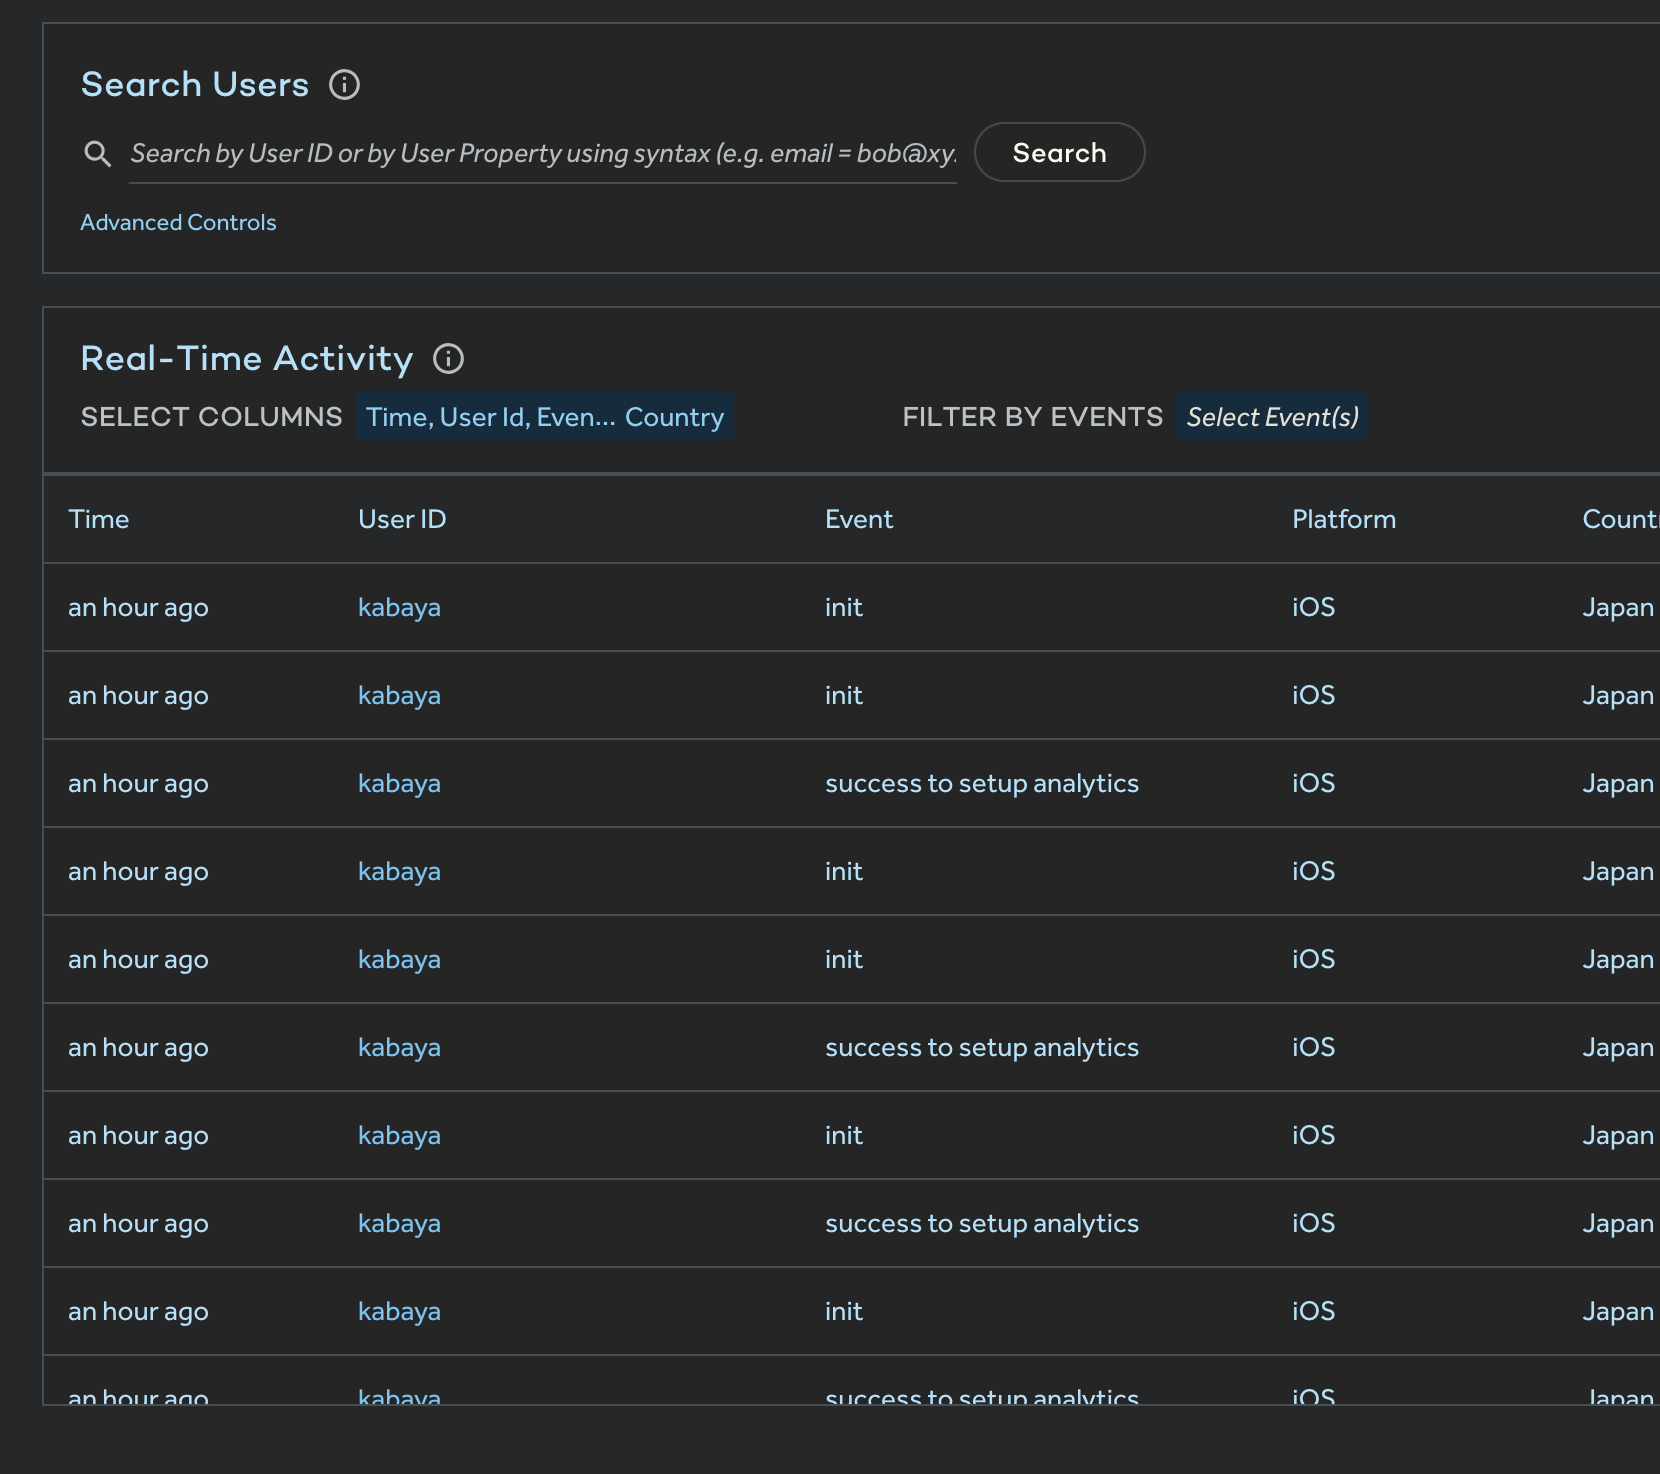
イベントページへ行くと、ちゃんとeventが呼ばれている!
あとは、eventを収集したい箇所に
Amptitude.logEvent('文字列')を仕込めばOK!
ちょっと複雑なことをやってみる。
具体的には、UserIdをセットして、グループとプロパティをセット、
プロパティ付きのeventも収集したい...
analytics.jsに以下の記述を加える。
// analytics.js
import {Amplitude} from 'expo'

Amplitude.initialize("97f362aa96e30dd43b924684984a664b")
Amplitude.logEvent("Hello World")

+Amplitude.setUserId("xxxx")
+Amplitude.setGroup("Expo person")
+Amplitude.setUserProperties("Woman")
+Amplitude.logEventWithProperties("Hello World", {heavyUser: 'yes'})
簡単ですね!
live streamでデバッグも出来るよ。
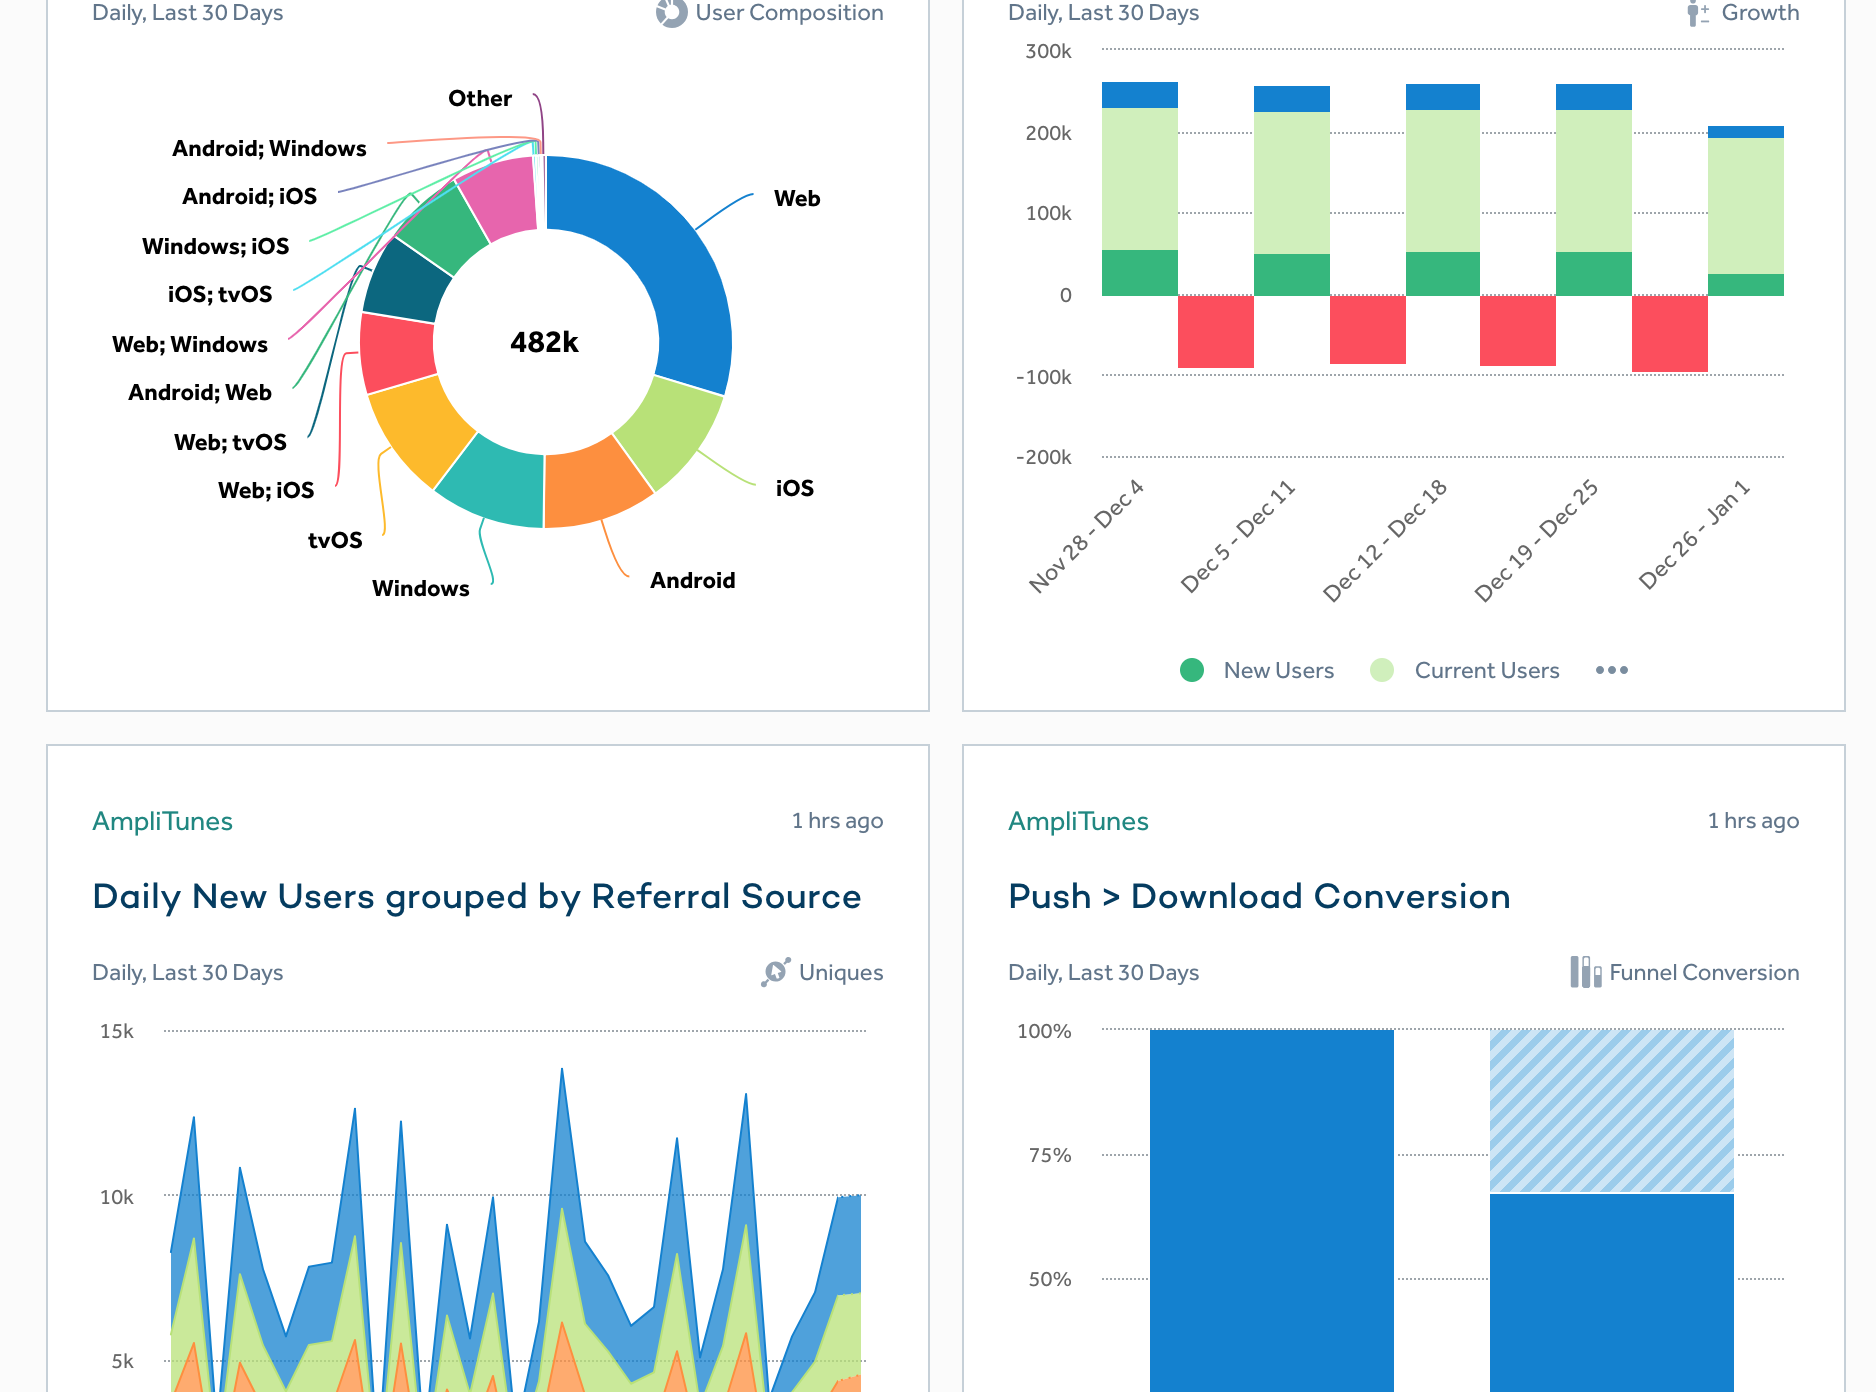
綺麗なチャートも使える。
analyticsに使えるメソッドは8個だけだが、それでも十分analyticsできますよー
若干機能が足りないと思う時もあるが、何より手軽なので、expoでanalyticsを入れたいときは一度試してみてはどうだろうか?