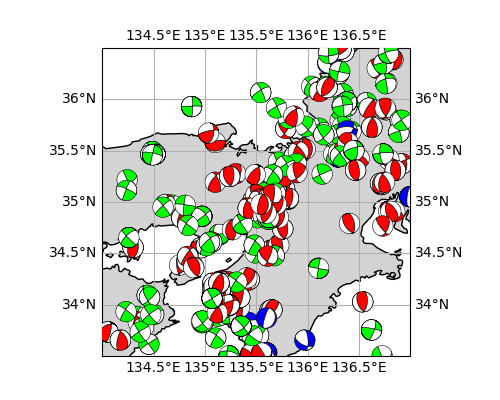
筆者が以前投稿した記事 ( Matplotlib+ObsPyで震源球(beachball)を書いてみた ) の最後で ObsPy と地図ライブラリの Cartopy との連携が未確認であると書きましたが、地図上での描画が可能であるということが判明したので、これについて記述しようと思います。
2022年3月21日追記:座標変換を伴う場合についても記述を加えました。
※表示している地震のデータは防災科学技術研究所が公開している地震のメカニズム ( 防災科研:メカニズム解の検索 ) からランダムに選びダウンロードしたものです。本ページ中の画像は個人がデモンストレーションとして描画したもので、その結果に学術的な意味を求めていません。
※本ページのスクリプトの利用は自己責任でお願いします。
描画例

1. 目次
1. 目次
2. このページの目的
3. 使用環境
4. Cartopyのインストール方法
5. 正距円筒図法(PlateCarree)の場合
6. それ以外の図法の場合
7. おわりに
8. 参考文献
2. このページの目的
下半球投影の震源球を、地図の上に描画すること。
3. 使用環境
- Windows 10
- conda 4.9.2
- python 3.8.5
- matplotlib 3.3.2
- obspy 1.2.2
- cartopy 0.18.0
cartopy はpipでインストールしました。
4. Cartopyのインストール方法
公式の記述によりますと Anaconda の環境を前提として、conda コマンドconda install -c conda-forge cartopy で入れるのが手っ取り早いそうです。また、required dependencies が満たされている状態ではpip install cartopy でインストールできるそうです。おそらくですが、Anaconda を使用している場合には pip でインストールしてもこの required dependency は自動で解決してくれるはずです。
ここからは蛇足ですが、公式インストーラーやストア経由で windows 10 に「直に」pythonをインストールした場合は、 Cartopy を導入するのは結構大変かもしれません。Anaconda に切り替える前に私が試したとき、 cartopy を pip で入れようとしたら proj のバージョンが低いと言われ、 proj を pip で入れようとしたら必要なバージョン ( proj4 ) がなくてダメで、proj4 をインストールしようとしたら OSGeo4w を入れる羽目になり、OSGeo4w をインストールしたはいいけどどうやって使うの?という状況に陥り、断念しました。初心者の私にもわかる記事があれば教えてください...
ちなみにUbuntuではAnacondaじゃなくても何の問題もなく入りました。Ubuntu は良い子です。
5. 正距円筒図法(PlateCarree)の場合
というわけで適当なスクリプトを実行してみます。筆者の前作で ObsPy は Matplotlib の Collection としてビーチボールを返してくれることが分かったので、地図上に描けることが分かっていれば意外とあっさりと書けます。正距円筒図法の場合は、obspy.imaging の beach に直接座標を代入することができます。
使用しているデータの冒頭部分は以下の通り。
longitude	latitude	depth	strike1	dip1	rake1	strike2	dip2	rake2	mantissa	exponent	type
136.3025	36.2495	11	63	59	94	236	31	84	2.66	21	1
135.5475	35.2028	20	334	85	11	243	79	175	9.92	21	2
136.72	    35.1692	14	3	70	105	145	25	55	3.43	21	1
134.8153	34.4015	11	293	87	28	201	62	177	4.23	21	2
これを以下のスクリプトと同じディレクトリに入れ、実行します。Cartopy での地図の描画に関しては、公式のスクリプト例およびこの方のブログ (リンクフリーということでしたので掲載させていただきます...)を参考にさせていただきました。地図の描画を工夫したい人はそちらをご覧ください。
import numpy as np
import pandas as pd
import cartopy.crs as ccrs
import matplotlib.pyplot as plt
import cartopy.feature as cfeature
import matplotlib.ticker as mticker
from obspy.imaging.beachball import beach

# 地図とグリッドの描画
fig = plt.Figure(figsize=(5,4))
ax = fig.add_subplot(111, projection=ccrs.PlateCarree()) # platecarree (正距円筒図法) で表示
ax.set_extent((134, 137, 33.5, 36.5)) # 領域の限定
grids = ax.gridlines(draw_labels=True) # ラベルありで緯線経線を描画
grids.xlocator = mticker.FixedLocator(np.arange(120,150,0.5)) # 0.5度ずつ
grids.ylocator = mticker.FixedLocator(np.arange(20,50,0.5))
ax.coastlines(resolution='10m') # 海岸線を分解能 10 m で描画
ax.add_feature(cfeature.LAND, color="lightgrey") # 陸地を灰色に

mfile = pd.read_csv("temp.csv") # データのファイル
mech = mfile[["strike1", "dip1", "rake1"]] # 発震機構解
loc = mfile[["longitude", "latitude"]] # 位置
typ = mfile[["type"]] # 正断層型か、など。0 = 正断層, 1 = 逆断層, 2 = 横ずれ断層
pallet = ["blue", "red", "lime"] # 断層タイプにより色分けする

for i in range(len(loc)) :
    beach1 = beach(mech.iloc[i,:],
          xy=loc.iloc[i,:],
                  width=0.2,
                  linewidth=0.4,
                  facecolor=pallet[int(typ.iloc[i,0])])
    # widthは°(設定では0.2°)、linewidth は図形の枠線の太さ(pt)
    ax.add_collection(beach1)

fig.savefig("sample.png")
plt.close(fig)
結果は冒頭と同じ。
6. それ以外の図法の場合
cartopy における折れ線グラフ(ax.plot)や散布図(ax.scatter)などではtransform=ccrs.PlateCarree()というオプションを加筆することにより座標変換を行うことができましたが、obspy.imaging の beachにはそのようなオプションが搭載されていません。そこで別の関数を用いて座標変換を個別に行います。なお、その際、widthの単位が変更され、実距離のメートルとなりますので注意が必要です。
import numpy as np
import pandas as pd
import cartopy.crs as ccrs
import matplotlib.pyplot as plt
import cartopy.feature as cfeature
import matplotlib.ticker as mticker
from obspy.imaging.beachball import beach

# 地図とグリッドの描画
fig = plt.Figure(figsize=(5, 4))
ax = fig.add_subplot(111, projection=ccrs.Mercator())  # メルカトル図法で表示
ax.set_extent((134, 137, 33.5, 36.5))  # 領域の限定
grids = ax.gridlines(draw_labels=True)  # ラベルありで緯線経線を描画
grids.xlocator = mticker.FixedLocator(np.arange(120, 150, 0.5))  # 0.5度ずつ
grids.ylocator = mticker.FixedLocator(np.arange(20, 50, 0.5))
ax.coastlines(resolution='10m')  # 海岸線を分解能 10 m で描画
ax.add_feature(cfeature.LAND, color="lightgrey")  # 陸地を灰色に

mfile = pd.read_csv("temp.csv")  # データのファイル
mech = mfile[["strike1", "dip1", "rake1"]]  # 発震機構解
loc = mfile[["longitude", "latitude"]]  # 位置
typ = mfile[["type"]]  # 正断層型か、など。0 = 正断層, 1 = 逆断層, 2 = 横ずれ断層
pallet = ["blue", "red", "lime"]  # 断層タイプにより色分けする

for i in range(len(loc)):
    mloc = ccrs.Mercator().transform_point(loc["longitude"].iloc[i],
                                           loc["latitude"].iloc[i],
                                           ccrs.PlateCarree())  # 座標変換
    beach1 = beach(mech.iloc[i, :], xy=mloc, width=55470, linewidth=1,
                   facecolor=pallet[int(typ.iloc[i, 0])])
    # widthは震源球の直径(メートル、0.5度はおよそ50,000m)、linewidth は図形の枠線の太さ(pt)
    ax.add_collection(beach1)

fig.savefig("sample.png")
plt.close(fig)
7. おわりに
やってみたら簡単でした。ただ現状これでは地図上でのプロットのみが可能であり、鉛直断面に震源球を描画する方法は現時点でも模索中です (たぶんやらない)。そういうのもできるという点でいえば GMT の方が圧倒的に自由度が高い気がします。 Python でやらないといけないという縛りがある状況以外では、このスクリプトに利用価値はないかもしれません。
8. 参考文献
- obspy.imaging - Plotting routines for ObsPy — ObsPy Documentation (1.2.0)
https://docs.obspy.org/packages/obspy.imaging.html -
- Beachball Plot — ObsPy Documentation (1.2.0)
https://docs.obspy.org/tutorial/code_snippets/beachball_plot.html
- Beachball Plot — ObsPy Documentation (1.2.0)
- obspy.imaging.beachball.beach — ObsPy Documentation (1.2.0)
https://docs.obspy.org/packages/autoge/obspy.imaging.beachball.beach.html#obspy.imaging.beachball.beach - 防災科学技術研究所 広帯域地震観測網 (F-net) メカニズム解の検索
https://www.fnet.bosai.go.jp/event/search.php?LANG=ja - Introduction — cartopy 0.18.0 documentation
https://scitools.org.uk/cartopy/docs/latest/index.html - Using cartopy with matplotlib — cartopy 0.18.0 documentation
https://scitools.org.uk/cartopy/docs/latest/matplotlib/intro.html - Python - (ベースマップ) Cartopyの導入 | ふシゼン
https://www.mitsumatado.com/zen/cartopy/