Elastic Stack
今回はBeatsで様々なログを収集。elasticsearchに格納。kibanaで可視化する環境までをdocker-composeで構築します。
docker-composeで構築するモチベーションとしては
-
dockerを使って簡単にデプロイ -
docker-composeだと構築設定をファイルで保存できる
なお、docker使わないで構築するならばElastic StackはElastic Stack製品ページからダウンロードして使うことができます。
本記事では手順のみ示します。設定ファイルの内容はドキュメントを読んで理解してください。
また、この記事で記している設定はあくまでも、お試し用です。本番運用の際は様々な観点からチューニングする必要があります。
構築環境
構築に使用した環境は以下の通り
- CentOS Linux release 7.4
- Docker version 18.03.1-ce, build 9ee9f40
- docker-compose version 1.22.0, build f46880fe
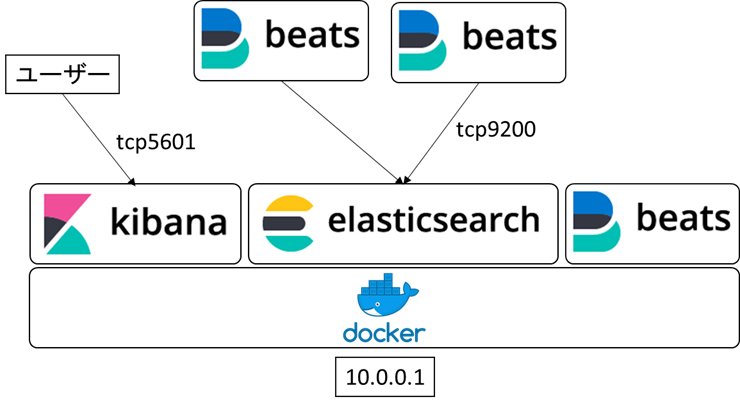
構成図
雑ですが、構築するElastic Stackの構成図です。各サーバーにMetricBeatを設置し、10.0.0.1サーバーにログを集約。kibanaを通してダッシュボードを閲覧します。
Elastic Stack構築手順
dockerとdocker-composeをインストール
-
dockerとdocker-composeをインストール(インストール方法は省略)
elasticsearchとkibanaをdockerを構築
- 以下のように
docker-compose.ymlを用意- 注)dockerボリュームを使ってデータを永続化している
- 上記
docker-compose.ymlを置いたディレクトリでdocker-compose up -dを実行
version: '2'
volumes:
  elastic:
    driver: 'local'

services:
  elasticsearch:
    image: docker.elastic.co/elasticsearch/elasticsearch:7.1.1
    expose:
      - 9200
    ports:
      - "9200:9200"
      - "9300:9300"
    tty: true
    environment:
      discovery.type: single-node
    volumes:
      - elastic:/usr/share/elasticsearch/data

  kibana:
    image: docker.elastic.co/kibana/kibana:7.1.1
    ports:
      - "5601:5601"
    depends_on:
      - elasticsearch
    environment:
      ELASTICSEARCH_URL: http://elasticsearch:9200
Metricbeatをdockerで構築
-
Metricbeatコンテナをdocker pull docker.elastic.co/beats/metricbeat:7.0.1で取得 -
Metricbeatコンテナを使ってkibanaとelasticsearchをセットアップ(kibanaにダッシュボードを作成等行う)
docker run \
docker.elastic.co/beats/metricbeat:7.1.1 \
setup -E setup.kibana.host=10.0.0.1:5601\
-E output.elasticsearch.hosts=["10.0.0.1:9200"]
-
Metricbeatを設定する Running Metricbeat on Docker-
とりあえず動かしたいときは
curl -L -O https://raw.githubusercontent.com/elastic/beats/7.0/deploy/docker/metricbeat.docker.ymlで設定ファイルを入手 -
Metricbeatコンテナを動かすために以下のようなdocker-compose.ymlを用意
-
version: '3'
services:
    metricbeat:
        image: docker.elastic.co/beats/metricbeat:7.1.1
        user: root
        volumes:
            - /proc:/hostfs/proc:ro
            - /sys/fs/cgroup:/hostfs/sys/fs/cgroup:ro
            - /:/hostfs:ro
            - /var/run/docker.sock:/var/run/docker.sock
            - ./metricbeat.docker.yml:/usr/share/metricbeat/metricbeat.yml:ro
        environment:
            - ELASTICSEARCH_HOST=10.0.0.1:9200
            - KIBANA_HOST=10.0.0.1:5601
        network_mode: "host"
        command: -system.hostfs=/hostfs
-
metricbeat.docker.ymlの所有者をrootにする(chown root:root metricbeat.docker.yml) -
Metricbeatをdocker-compose up -dでコンテナを起動
metricbeat.docker.ymlの設定例
以下のmetricbeat.docker.ymlはシステムとdockerコンテナの情報を収集する設定になっている
metricbeat.config:
  modules:
    path: ${path.config}/modules.d/*.yml
    # Reload module configs as they change:
    reload.enabled: true

metricbeat.autodiscover:
  providers:
    - type: docker
      hints.enabled: true

metricbeat.modules:
- module: docker
  metricsets:
    - "container"
    - "cpu"
    - "diskio"
    - "healthcheck"
    - "info"
    #- "image"
    - "memory"
    - "network"
  hosts: ["unix:///var/run/docker.sock"]
  period: 10s
  enabled: true

- module: system
  metricsets:
    - cpu             # CPU usage
    - load            # CPU load averages
    - memory          # Memory usage
    - network         # Network IO
    - process         # Per process metrics
    - process_summary # Process summary
    - uptime          # System Uptime
    - socket_summary  # Socket summary
    - core           # Per CPU core usage
    - diskio         # Disk IO
    - filesystem     # File system usage for each mountpoint
    - fsstat         # File system summary metrics
    - raid           # Raid
    - socket         # Sockets and connection info (linux only)
  enabled: true
  period: 10s
  processes: ['.*']

  # Configure the metric types that are included by these metricsets.
  process.include_top_n:
    by_cpu: 5      # include top 5 processes by CPU
    by_memory: 5   # include top 5 processes by memory:
  cpu.metrics:  ["percentages"]  # The other available options are normalized_percentages and ticks.
  core.metrics: ["percentages"]  # The other available option is ticks.

processors:
  - add_cloud_metadata: ~

output.elasticsearch:
  hosts: '10.0.0.1:9200'
参考
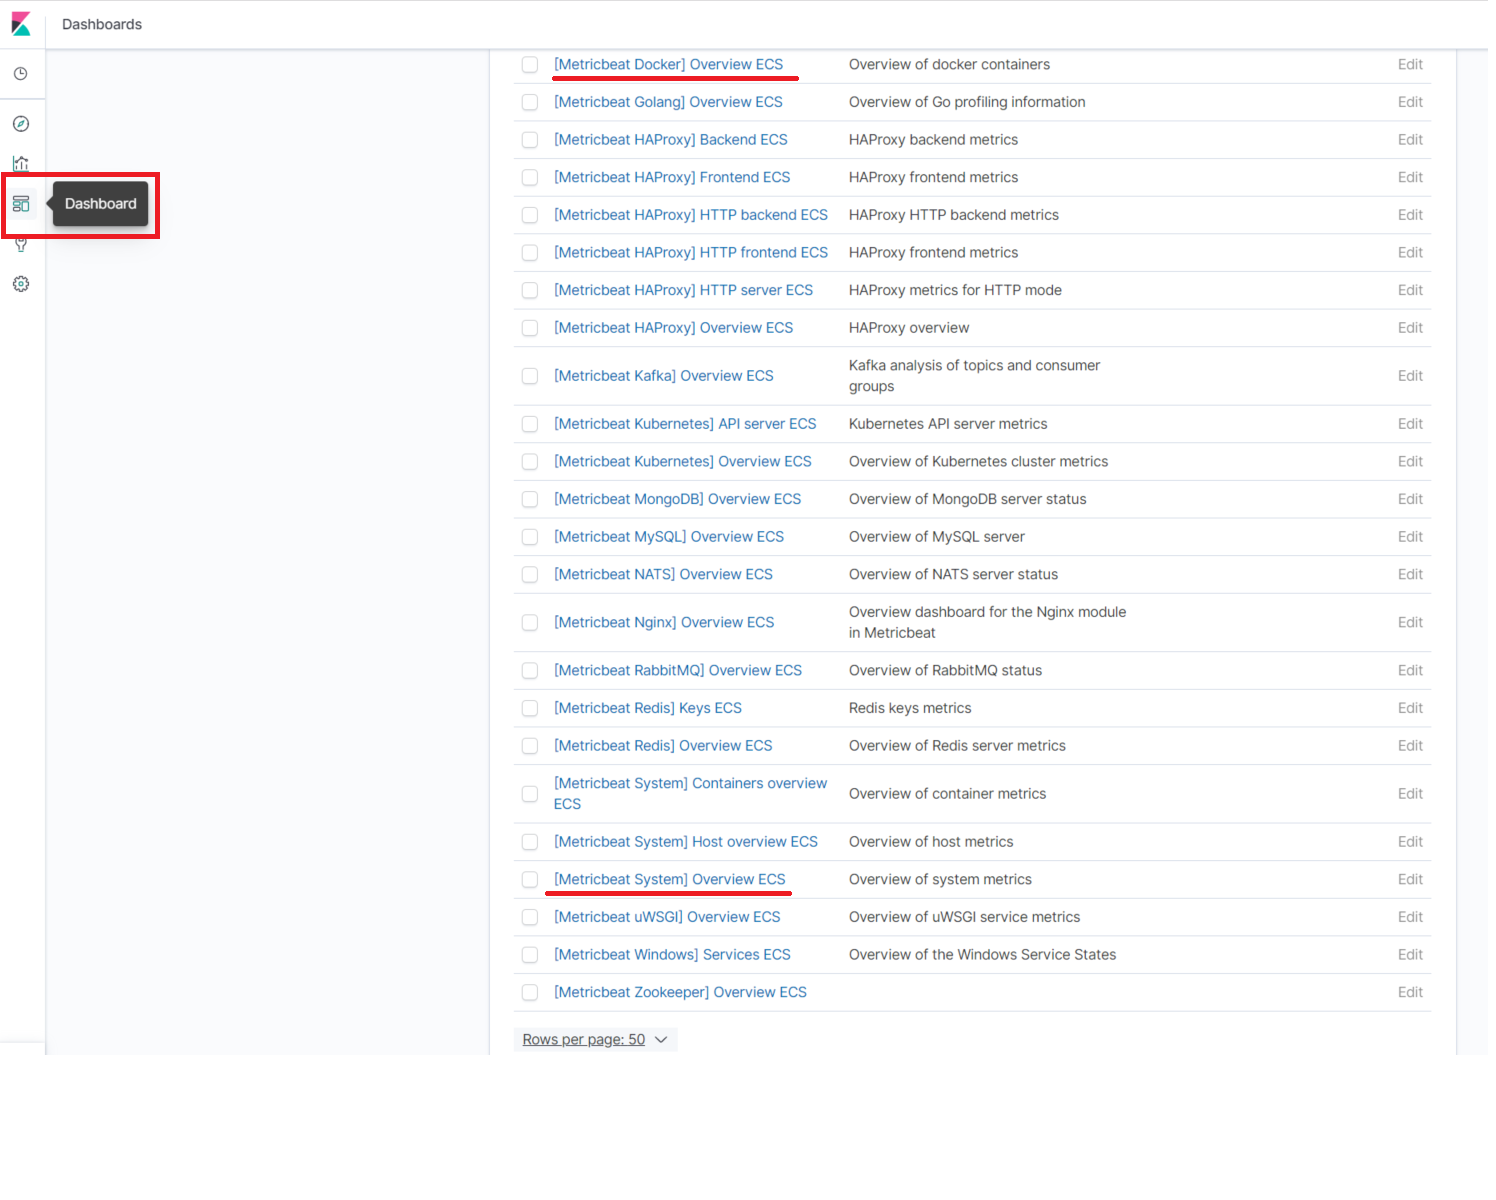
ダッシュボードを確認
- 左のバナーからダッシュボードを選択。
-
metricbeat.docker.ymlの設定例ですと[Metricbeat System] Overview ECSと[Metricbeat Docker] Overview ECSのダッシュボードが見れます。
このように簡単に情報収集、そしてダッシュボードも見ることができます。
さらに情報を収集したい項目がありましたら、elasticsearchはドキュメントも充実しているので、以下を参考にしてください。