0.はじめに
ベクトルタイル、及びMapLibre GL JSの使用に慣れるため、MapLibre GL JSで地理院地図Vectorを表示してみます。
MapLibre GL JS
MapLibre GL JSとは、ベクトルタイルから地図を簡単に表示できるTypeScriptライブラリです。Mapbox GL JS v1.13.0からフォークして作られました。Mapbox GL JS v1では、スタイル、ソースがMapboxのサーバにホストされている場合のみ課金対象でした。しかし、2020年12月、v2にアップデートされた際、Mapboxのサーバにホストされているかの有無によらず課金対象となりました。そのため、Mapboxのオープンソース版を残すべく、「少年よ大志を抱け」の言葉に感化された人々の情熱により(?)、MapLibreが誕生しました。
地理院地図Vector
ベクトルタイルの適切な提供方法を研究開発することを目的として、実験的にベクトルタイルが提供されています。データを利用する際は、「地理院地図Vector」などと、出典の明示を行う必要があります。
1.MapLibre GL JSを使用して、とりあえず地図を表示する
何はともあれ、とりあえずMapLibre GL JSを使用してウェブ地図を表示させてみます。
MaplLibre GL JSのExampleのページで紹介されているコードを使用します。
<!DOCTYPE html>
<html lang="en">
  <head>
    <title>Display a map</title>
    <meta
      property="og:description"
      content="Initialize a map in an HTML element with MapLibre GL JS."
    />
    <meta charset="utf-8" />
    <meta name="viewport" content="width=device-width, initial-scale=1" />
    <link
      rel="stylesheet"
      href="https://unpkg.com/maplibre-gl@4.1.3/dist/maplibre-gl.css"
    />
    <script src="https://unpkg.com/maplibre-gl@4.1.3/dist/maplibre-gl.js"></script>
    <style>
      body {
        margin: 0;
        padding: 0;
      }
      html,
      body,
      #map {
        height: 100%;
      }
    </style>
  </head>
  <body>
    <div id="map"></div>
    <script>
      const map = new maplibregl.Map({
        container: "map", // container id
        style: "https://demotiles.maplibre.org/style.json", // style URL
        center: [0, 0], // starting position [lng, lat]
        zoom: 1, // starting zoom
        maplibreLogo: true,
      });
    </script>
  </body>
</html>
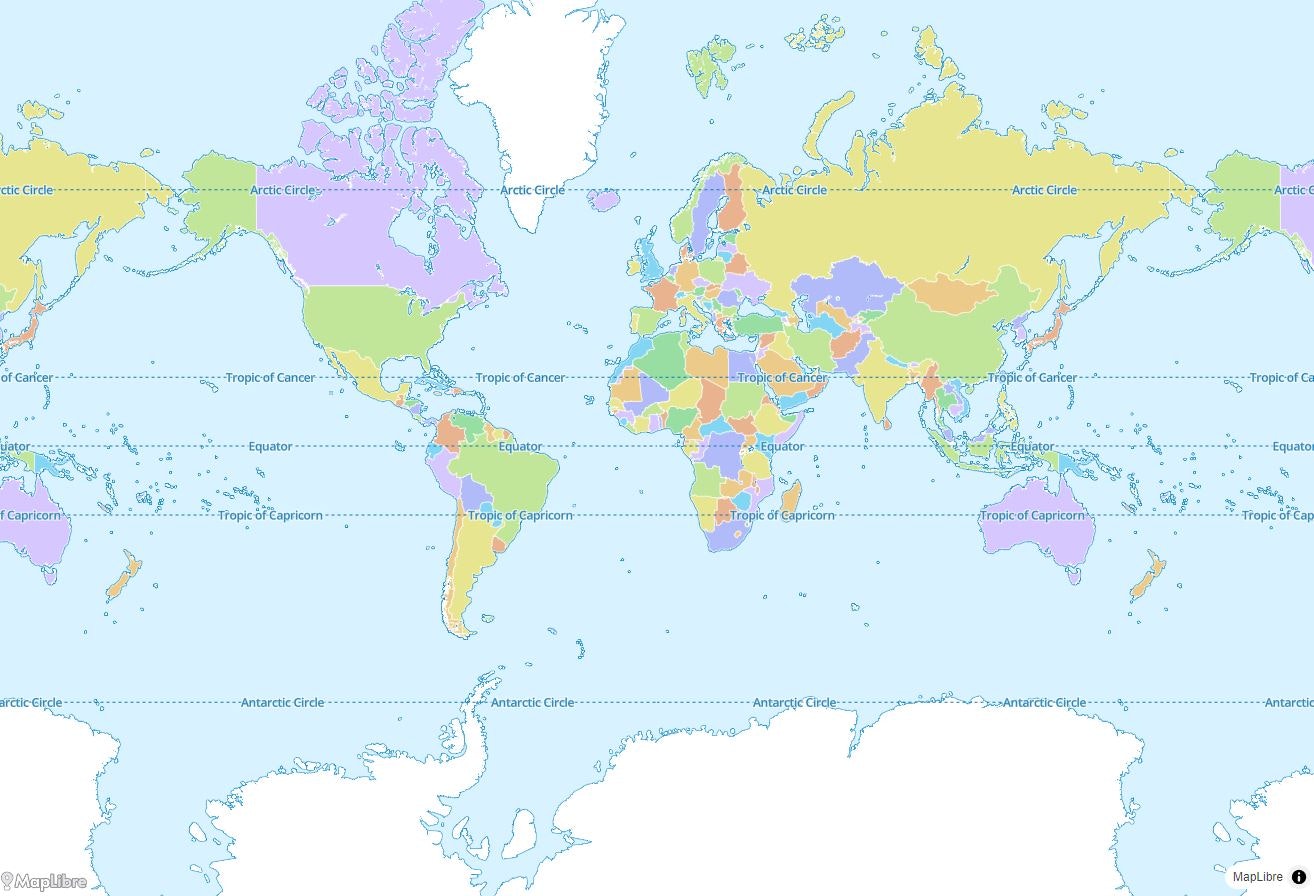
ローカルフォルダにindex.htmlとして保存して、ブラウザで開くと無事に地図が表示されます。
2.MapLibre GL JSで地理院地図Vectorを表示する
続いて、先ほどのコードのstyleの参照先を変更します。地理院地図Vector提供実験で紹介されているスタイルを使用します。今回は淡色地図のスタイルを使用することにしました。使用するスタイルファイルのURLは以下です。
https://gsi-cyberjapan.github.io/gsivectortile-mapbox-gl-js/pale.json
注意点
地理院地図Vector提供実験サイトにも「地理院地図Vectorのstyle.jsonでは、Style Specificationをベースに、若干の拡張を施しています。」と記載されている通り、地理院地図VectorのスタイルファイルはMapLibre Style Specificationとは仕様が異なるため、MapLibre GL JSでは使えないので注意が必要です。つまりは、今回使用するスタイルファイルは"sources"や"layers"が使われていますが、gsimaps-vector-experimentのページのstyle.jsonの項目のスタイルファイルは、"sources"や"layers"が使われておらず異なる仕様のためMapLibre GL JSでは使用できません。
中心座標と初期ズームレベルの値も変更しました。先ほどのコードと比べて、style, center, zoomのみ変更した、修正後のコードは以下です。
<!DOCTYPE html>
<html lang="en">
  <head>
    <title>Display a map</title>
    <meta
      property="og:description"
      content="Initialize a map in an HTML element with MapLibre GL JS."
    />
    <meta charset="utf-8" />
    <meta name="viewport" content="width=device-width, initial-scale=1" />
    <link
      rel="stylesheet"
      href="https://unpkg.com/maplibre-gl@4.1.3/dist/maplibre-gl.css"
    />
    <script src="https://unpkg.com/maplibre-gl@4.1.3/dist/maplibre-gl.js"></script>
    <style>
      body {
        margin: 0;
        padding: 0;
      }
      html,
      body,
      #map {
        height: 100%;
      }
    </style>
  </head>
  <body>
    <div id="map"></div>
    <script>
      const map = new maplibregl.Map({
        container: "map", // container id
        style:
          "https://gsi-cyberjapan.github.io/gsivectortile-mapbox-gl-js/pale.json", // style URL
        center: [139.767144, 35.680621], // starting position [lng, lat]
        zoom: 12, // starting zoom
        maplibreLogo: true,
      });
    </script>
  </body>
</html>
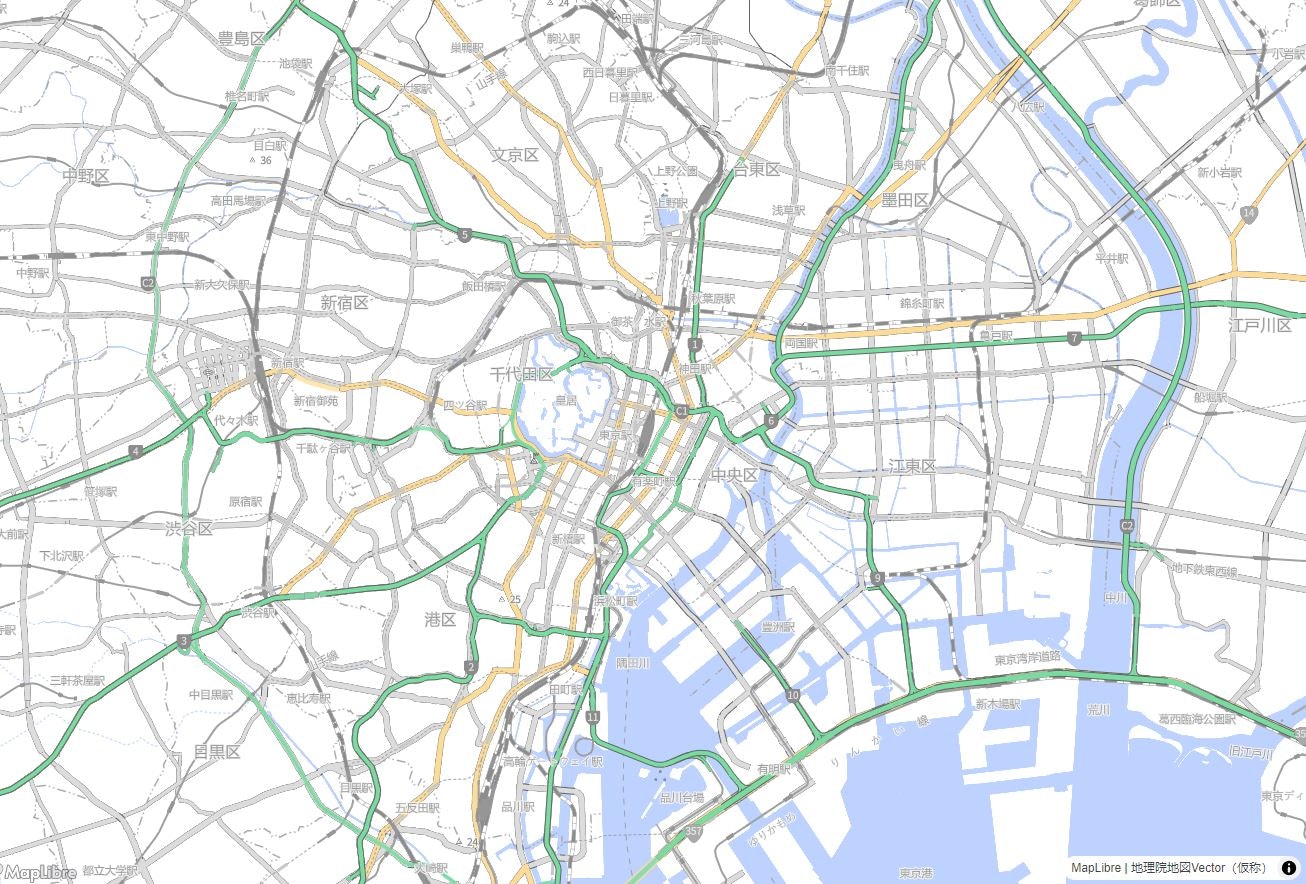
作成したHTMLファイルをGitHub Pagesを使用してウェブサーバにアップロードしました。こちらのリンクから以下のような地図が見られます。
3.まとめ
MapLibre GL JSを使用して地理院地図Vectorを表示してみました。記事に誤り等あれば、教えていただけると嬉しいです。
4.リファレンス