はじめに
ArcGISサーバ以外でホストしているベクトルタイルを、ArcGIS Onlineでホストするための練習をしたいと思います。こちらの記事を参考にさせていただいています。
Node.jsサーバを立ち上げて、そこで地理院地図ベクター(仮称) (国土地理院の運用するサーバーからpbfタイルが提供されている)を利用します。まずは、localhostで試してみて、その後にレンタルサーバでも同様のことを実験してみます。
環境
localhost
mac OS: 15.2(24C101)
チップ:Apple M3
Node: v16.20.2
npm: 8.19.4
レンタルサーバ
OS: Rocky Linux 8
メモリ: 1GB
ストレージ: 25GB SSD
node version: v16.20.2 ※nvmで管理
npm version: 8.19.4
使用データ
・地理院地図Vector(仮称)
タイルURL:
https://cyberjapandata.gsi.go.jp/xyz/experimental_bvmap/{z}/{x}/{y}.pbf
・本提供実験のデータは、国土地理院コンテンツ利用規約に従って利用できます。データを利用する際は、「国土地理院ベクトルタイル提供実験」などと、出典の明示を行ってください。
・スタイル: 公開されているのはレイヤ数が多く複雑なので、参考記事にあるスタイルファイルを利用させてもらいました。
こちらの記事でみた通り、タイルの保存等でエラーを回避するには「rest/services」をURLに加える必要があります。それを考慮して記事のコードを記載しています。
手順
Step 0: GitHubレポジトリ
こちらにGitHubレポジトリを用意しました。
Step1: 必要な機能の整理
・ArcGISオンライン用のベクトルタイルサーバ概要(index.json)を返す機能。
・Style情報(json形式)を返す機能。
style.json(リクエストはroot.jsonでくる)は事前に用意しておく。
・オーバーズーミングのために、タイルの存在を教える機能(Tilemap)
以下の(データセット名)には、実際には「gsimaps-vector-experiment」が入ります。
| サービス | リクエストパス |
|---|---|
| ベクトルタイルサーバ概要 | /esriIF/(データセット名)/VectorTileServer |
| スタイル | /esriIF/(データセット名)/VectorTileServer/resources/styles |
| タイルマップ | /esriIF/(データセット名)/VectorTileServer/tilemap/<level>/<row>/<column>/<width>/<height> |
参考記事にもありますが、スタイルのパスは、ドキュメントではVectorTileServer/resources/style となっていますが、実際の例ではVectorTileServer/resources/styles となっているので、今回も「styles」を使用します。
Step 2: サーバーの準備
app.jsを以下のとおり準備します。
const config = require('config');
const express = require('express');
const cors = require('cors');
const morgan = require('morgan');
const winston = require('winston');
const DailyRotateFile = require('winston-daily-rotate-file');

// config constants
const morganFormat = config.get('morganFormat');
const htdocsPath = config.get('htdocsPath');
const port = config.get('port');
const logDirPath = config.get('logDirPath');

// logger configuration
const logger = winston.createLogger({
  transports: [
    new winston.transports.Console(),
    new DailyRotateFile({
      filename: `${logDirPath}/server-%DATE%.log`,
      datePattern: 'YYYY-MM-DD',
    }),
  ],
});

logger.stream = {
  write: message => {
    logger.info(message.trim());
  },
};

// app
const app = express();
var VTRouter = require('./routes/VT'); //tiling
var esriIFRouter = require('./routes/esriIF'); //esri interface (tilemap, etc..)
app.use(cors());
app.use(
  morgan(morganFormat, {
    stream: logger.stream,
  })
);
app.use(express.static(htdocsPath));
// app.use('/VT', VTRouter);
app.use('/rest/services/VT', VTRouter);
// app.use('/esriIF', esriIFRouter); //esri interface
app.use('/rest/services/esriIF', esriIFRouter); //esri interface

//for http
app.listen(port, () => {
  console.log(`Running at Port ${port} ...`);
});

/* for https
const fs = require('fs')
const spdy = require('spdy') //for https
const privkeyPath = config.get('privkeyPath') //for https
const fullchainPath = config.get('fullchainPath') //for https
spdy.createServer({
  key: fs.readFileSync(privkeyPath),
  cert: fs.readFileSync(fullchainPath)
}, app).listen(port)
*/
app.use('/rest/services/VT', VTRouter);
app.use('rest/services/esriIF', esriIFRouter);
としているのが、ポイントです。
上記コードは参考記事のGithubの通りですが、参考記事のコードは
var VTRouter = require('./routes/VT')
などの記述が含まれておらず、記載が異なるため注意が必要です。
コンフィグ設定は以下です。
{
 morganFormat: tiny
 htdocsPath: htdocs
 privkeyPath: ./key/privkey.pem
 fullchainPath: ./key/cert.pem
 logDirPath: log
 port: 3000
 mbtilesDir: mbtiles
 esriDir: esri
 esri-tilemap-min:{
  gsimaps-vector-experiment: 4
  gsimaps-vector-style: 4
 }
 esri-tilemap-max:{
  gsimaps-vector-experiment: 17
  gsimaps-vector-style: 17
 }
}
ポート番号は3000にしました。Tilemapで使うために、ここで読み込むデータセット(gsimaps-vector-experiment)とその最大ズームレベル、最小ズームレベルを指定します。
Step 3: esri関係インターフェース
routes/esriIF.jsを準備しました。.../esriIFにきたリクエストを./routes/esriIF.jsで処理します。
ポイントは以下のとおりです。
3-1. ArcGISオンライン用のベクトルタイル(サーバー)概要(index.json)を返す機能
router.get(`/:t/VectorTileServer`, async function (req, res) {
  busy = true;
  const t = req.params.t;
  var indexjsonPath = `${esriDir}/${t}/index.json`;

  if (fs.existsSync(indexjsonPath)) {
    res.sendFile('index.json', { root: `./${esriDir}/${t}` });
    busy = false;
  } else {
    console.log(indexjsonPath);
    res.status(404).send(`index.json not found: esriIF/${t}/VectorTileServer`);
    busy = false;
  }
});
/:t/VectorTileServer(= gsimaps-vector-experiment/VectorTileServer)に来たリクエストに対して、./\${esriDir}/${t}(= ./esri/gsimaps-vector-experiment)にあるindex.jsonを返します。
/:t/VectorTileServer/index.jsonというリクエストに備えて、再度同じコードが必要なようです。/:t/VectorTileServer/index.jsonのリクエストは、上記コードがあれば処理されると思っていましたが、試したみたところ処理されませんでした。やはり、再度同じコードが必要でした。
3-2. Style情報(json形式)を返す機能
router.get(
  `/:t/VectorTileServer/resources/styles`, //need to think about other request f=json, index.json etc
  async function (req, res) {
    busy = true;
    const t = req.params.t;
    var stylejsonPath = `${esriDir}/${t}/style.json`;

    if (fs.existsSync(stylejsonPath)) {
      res.sendFile('style.json', { root: `./${esriDir}/${t}` });
      busy = false;
    } else {
      console.log(stylejsonPath);
      res
        .status(404)
        .send(
          `style.json (root.json) not found: esriIF/${t}/VectorTileServer/resources/style`
        );
      busy = false;
    }
  }
);
/:t/VectorTileServer/resources/styles(= gsimaps-vector-experiment/VectorTileServer/resources/styles)に来たリクエストに対して、./\${esriDir}/${t}(= ./esri/gsimaps-vector-experiment)にあるstyle.jsonを返します。
/:t/VectorTileServer/resources/styles/root.jsonというリクエストに備えて、再度同じコードが必要なようです。
→確認してみたところ、ホントに必要でした。
パスに ?f=pjsonなどがついてくることもありますが、これで大丈夫らしいです。
→確認してみたところ、ホントに大丈夫でした。
3-3. タイルマップ
タイルマップの特徴はこちらの記事で記載しています。
以下の形式でリクエストがあります。
tilemap/<level>/<row>/<column>/<width>/<height>
rowがレスポンスのtopに、columnがレスポンスのleftに対応します。
width、height(リクエストもレスポンスも)は必ず32となります。
それぞれのタイルの有無を個別に指定するのは難しいので、ベクトルタイルデータセットの存在するズームレベルの範囲内であれば、タイルマップは全て1(タイルがあるという意味)を、ズームレベルの範囲外ならタイルがないというcode 422を返すという方針としています。
if (z < 5) {
  tmapdata = tmapdataFull[z];
} else {
  tmapdata = tmapdataFull[5];
}
res.json({
  adjusted: false,
  location: { left: column, top: row, width: width, height: height },
  data: tmapdata,
});
上記がポイントとなるコードを抜き出したものです。ズームレベルが5未満の場合は、それぞれ用意されたタイルマップの"data"を使用します。ズームレベルが5以上の場合は、タイルマップのdataは全て1(タイルが全てあり)を返します。
rowとcolumnは32の倍数となりますが、rowとcolumnの数字をそれぞれtopとleftに入れれば良いだけなので、32の倍数を意識しなくても問題ありません。
静的と動的の違いがあまり分かっていませんでしたが、ようやく理解しました。静的だと例えば、
https://k96mz.github.io/20250117tilemap/VectorTileServer/tilemap/1/0/0/32/32/?f=json
とリクエストがあった場合に、このリクエストに対応するファイルを以下のように用意しておく必要があります。
https://github.com/k96mz/20250117tilemap/blob/main/VectorTileServer/tilemap/1/0/0/32/32/index.json
つまり、クライアントからリクエストが来たときに返すべきレスポンスが、すでにサーバー上にファイルとして用意されています。
動的だと、リクエストURLに合わせて必要なレスポンスを返しています。動的ファイルを使用することで、多くのファイルを事前に用意しておかなくて良いので便利だと思います。
Step4 JSONファイルの準備
Step3までで、サーバーの準備ができました。次に、esri/gsimaps-vector-experimentというフォルダを作って、その中にindex.jsonとstyle.jsonを準備します。
4-1 index.json
{
  "currentVersion": 10.9,
  "name": "GSImaps Vector test",
  "copyrightText": "地理院地図Vector(仮称)",
  "capabilities": "TilesOnly,Tilemap",
  "type": "indexedVector",
  "tileMap": "tilemap",
  "defaultStyles": "resources/styles",
  "tiles": [
    "https://cyberjapandata.gsi.go.jp/xyz/experimental_bvmap/{z}/{x}/{y}.pbf"
  ],
  "initialExtent": {
    "xmin": -2.0037507842788246e7,
    "ymin": -2.0037508342787e7,
    "xmax": 2.0037507842788246e7,
    "ymax": 2.0037508342787e7,
    "spatialReference": {
      "wkid": 102100,
      "latestWkid": 3857
    }
  },
  "fullExtent": {
    "xmin": -2.0037507842788246e7,
    "ymin": -2.0037508342787e7,
    "xmax": 2.0037507842788246e7,
    "ymax": 2.0037508342787e7,
    "spatialReference": {
      "wkid": 102100,
      "latestWkid": 3857
    }
  },
  "minScale": 2.958287637957775e8,
  "maxScale": 282.124294,
  "tileInfo": {
    "rows": 512,
    "cols": 512,
    "dpi": 96,
    "format": "pbf",
    "origin": {
      "x": -2.0037508342787e7,
      "y": 2.0037508342787e7
    },
    "spatialReference": {
      "wkid": 102100,
      "latestWkid": 3857
    },
    "lods": [
      {
        "level": 0,
        "resolution": 78271.516964,
        "scale": 2.958287637957775e8
      },
      {
        "level": 1,
        "resolution": 39135.75848199995,
        "scale": 1.479143818978885e8
      },
      {
        "level": 2,
        "resolution": 19567.87924100005,
        "scale": 7.39571909489445e7
      },
      {
        "level": 3,
        "resolution": 9783.93962049995,
        "scale": 3.6978595474472e7
      },
      {
        "level": 4,
        "resolution": 4891.96981024998,
        "scale": 1.8489297737236e7
      },
      {
        "level": 5,
        "resolution": 2445.98490512499,
        "scale": 9244648.868618
      },
      {
        "level": 6,
        "resolution": 1222.992452562495,
        "scale": 4622324.434309
      },
      {
        "level": 7,
        "resolution": 611.496226281245,
        "scale": 2311162.2171545
      },
      {
        "level": 8,
        "resolution": 305.74811314069,
        "scale": 1155581.1085775
      },
      {
        "level": 9,
        "resolution": 152.874056570279,
        "scale": 577790.5542885
      },
      {
        "level": 10,
        "resolution": 76.4370282852055,
        "scale": 288895.2771445
      },
      {
        "level": 11,
        "resolution": 38.2185141425366,
        "scale": 144447.638572
      },
      {
        "level": 12,
        "resolution": 19.1092570712683,
        "scale": 72223.819286
      },
      {
        "level": 13,
        "resolution": 9.55462853563415,
        "scale": 36111.909643
      },
      {
        "level": 14,
        "resolution": 4.777314267817075,
        "scale": 18055.9548215
      },
      {
        "level": 15,
        "resolution": 2.388657133974685,
        "scale": 9027.977411
      },
      {
        "level": 16,
        "resolution": 1.19432856698734,
        "scale": 4513.9887055
      },
      {
        "level": 17,
        "resolution": 0.597164283427525,
        "scale": 2256.9943525
      },
      {
        "level": 18,
        "resolution": 0.2985821417799085,
        "scale": 1128.4971765
      },
      {
        "level": 19,
        "resolution": 0.1492910708238085,
        "scale": 564.248588
      },
      {
        "level": 20,
        "resolution": 0.07464553541190416,
        "scale": 282.124294
      }
    ]
  },
  "maxzoom": 20,
  "resourceInfo": {
    "styleVersion": 8,
    "tileCompression": "gzip",
    "cacheInfo": {
      "storageInfo": {
        "packetSize": 128,
        "storageFormat": "compactV2"
      }
    }
  },
  "minLOD": 0,
  "maxLOD": 17,
  "exportTilesAllowed": false,
  "maxExportTilesCount": 100000,
  "supportedExtensions": ""
}
defaultStylesの場所も書いておきます。ArcGIS REST APIsドキュメントに書いているものと同じです。
参考記事では、maxLODが0となっていましたが、17に修正しました。こちらの記事で見た通り、Map Viewer ClassicとMap Viewerの表示仕様に違いがあるため、Map Viewerではうまく表示されないと思われるからです。
4-2 style.json
{
  "version": 8,
  "name": "GSI Vector -simple test",
  "sources": {
    "v": {
      "type": "vector",
      "url": "https://k96mz.net/rest/services/esriIF/gsimaps-vector-experiment/VectorTileServer",
      "attribution": "<a href=\"https://maps.gsi.go.jp/vector/\" target=\"_blank\">地理院地図Vector(仮称)</a>"
    }
  },
  "sprite": "https://gsi-cyberjapan.github.io/gsivectortile-mapbox-gl-js/sprite/std",
  "glyphs": "https://maps.gsi.go.jp/xyz/noto-jp/{fontstack}/{range}.pbf",
  "layers": [
    {
      "id": "background",
      "type": "background",
      "paint": { "background-color": "#D6EBF5" }
    },
    {
      "id": "ls-coastline",
      "type": "line",
      "source": "v",
      "source-layer": "coastline",
      "minzoom": 4,
      "maxzoom": 9,
      "layout": { "visibility": "visible" },
      "paint": { "line-color": "#636566" }
    },
    {
      "id": "pg-watera",
      "type": "fill",
      "source": "v",
      "source-layer": "waterarea",
      "minzoom": 4,
      "maxzoom": 7,
      "paint": { "fill-color": "rgba(46, 0, 255, 1)" }
    },
    {
      "id": "ls-boundary-pref",
      "type": "line",
      "source": "v",
      "source-layer": "boundary",
      "minzoom": 6,
      "maxzoom": 8,
      "filter": ["all", ["==", "ftCode", 51212]],
      "layout": { "line-cap": "square" },
      "paint": { "line-color": "#000000", "line-dasharray": [10, 2, 1, 2] }
    },
    {
      "id": "ls-boundary-cty",
      "type": "line",
      "source": "v",
      "source-layer": "boundary",
      "minzoom": 4,
      "maxzoom": 8,
      "filter": ["all", ["==", "ftCode", 51221]],
      "layout": { "line-cap": "square" },
      "paint": { "line-color": "rgba(34, 24, 21, 1)" }
    }
  ],
  "_ssl": true
}
参考記事において
"url": "../../",
とするとArcGIS Onlineで「コンテンツ」に登録したレイヤーを「マップ」で開くときに読み込みのエラーになるとのことなので、絶対パスでレンタルサーバのurlを指定しています。
VectorTileServerで終わるパスをいれていますが、最後にスラッシュをいれるとそれもエラーになるとのことなので、スラッシュは抜いています。
Step5 サーバをスタートする
localhost
まずはlocalhostでサーバを立ち上げてみます。
package.jsonを作成します。
npm init
必要なモジュールをインストールします。
npm i @mapbox/mbtiles config cors express hjson morgan sqlite3 spdy winston winston-daily-rotate-file
サーバを立ち上げます。
node app.js
ベクトルタイルサーバー概要
以下の2つのアドレスで、index.jsonが表示されました。
http://localhost:3000/rest/services/esriIF/gsimaps-vector-experiment/VectorTileServer
http://localhost:3000/rest/services/esriIF/gsimaps-vector-experiment/VectorTileServer/index.json
スタイル
以下の3つのアドレスで、style.jsonが表示されました。
http://localhost:3000/rest/services/esriIF/gsimaps-vector-experiment/VectorTileServer/resources/styles
http://localhost:3000/rest/services/esriIF/gsimaps-vector-experiment/VectorTileServer/resources/styles/root.json
http://localhost:3000/rest/services/esriIF/gsimaps-vector-experiment/VectorTileServer/resources/styles/root.json?f=pjson
タイルマップ
例えば、以下のアドレスで、tilemapファイルが表示されました。
http://localhost:3000/rest/services/esriIF/gsimaps-vector-experiment/VectorTileServer/tilemap/3/0/0/32/32
上記のズームレベル3に対するURLでは、default.hjsonにおいて最低ズームレベルを4としているため、以下が返ります。
{"error":{"code":422,"message":"Tiles not present","details":[]}}
下の2つは通常のtilemapが返ります。
http://localhost:3000/rest/services/esriIF/gsimaps-vector-experiment/VectorTileServer/tilemap/4/0/0/32/32
http://localhost:3000/rest/services/esriIF/gsimaps-vector-experiment/VectorTileServer/tilemap/6/32/64/32/32
レンタルサーバ
次にレンタルサーバでサーバを立ち上げます。
サーバに入り、その後cloneします。
git clone https://github.com/k96mz/20250121piedmontite.git
その他、以下を実行します。
・npm iでモジュールをインストール
・./key/privkey.pem と./key/cert.pemに該当ファイルを置く
・app.jsのhttpに関するコードをコメントアウトし、httpsに関するコードを復活させ、apps.jsとして保存
・default.hjsonのポート番号を443に変更
443ポートはスーパーユーザ権限が必要であり、その場合はnodeのパスが必要なので、以下のようにします。
sudo ~/.nvm/versions/node/v16.20.2/bin/node apps.js
以下のURLからindex.htmlファイルを見ることができます。
https://k96mz.net

index.html中のリンクを押すと、それぞれファイルが見られます。
Step6 ArcGIS Onlineでみる
ArcGIS OnlineのMapでAddボタンをおして、Add Layer from Webで作成した以下のURLを入れます。
https://k96mz.net/rest/services/esriIF/gsimaps-vector-experiment/VectorTileServer
なぜかエラーが発生しました。

参考記事にある以下のURLで読み込んでみたところ、読み込み時にエラーは発生しませんでしたが、レイヤは読み込まれませんでした。
https://www.unvt-test.com/esriIF/gsimaps-vector-experiment/VectorTileServer
https://www.unvt-test.com/esriIF/gsimaps-vector-experiment/VectorTileServer/resources/styles
ちなみに参考記事のサーバのstyle.jsonのurlは上記URLから分かるように以下のようになっています。
"url": "../../",
エラー原因が不明なため、再度コードを用意しました。Githubページはこちらです。同じコードを用意したつもりですが、どこか違っているのかもしれません。
こちらで試すと、読み込み時にエラーは発生しませんでした。ちょうどレンタルサーバの証明書期限が切れましたが、レイヤは表示されました。

レイヤの保存も出来ました。
色々試して分かったのですが、Map Viewer ClassicのデフォルトであるClear Map Plainがベースマップの時にはうまく読み込めないようです。
例えば、unvtを表示したmap viewer classicだと読み込めます。
20250121piedmontiteのコードは引き続きエラーが発生します。
style.jsonは読み込んでいて、index.jsonを読み込んでいないので、やはりstyle.jsonからindex.jsonが読み込まれていないのかもしれません。
mbtilesも表示出来るか試してみる
index.jsonのtilesを以下のURLにして試してみました。
https://k96mz.net/rest/services/VT/zxy/ne-test/{z}/{x}/{y}.pbf
タイル自体は読み込まれているようですが、適切に表示出来ませんでした。
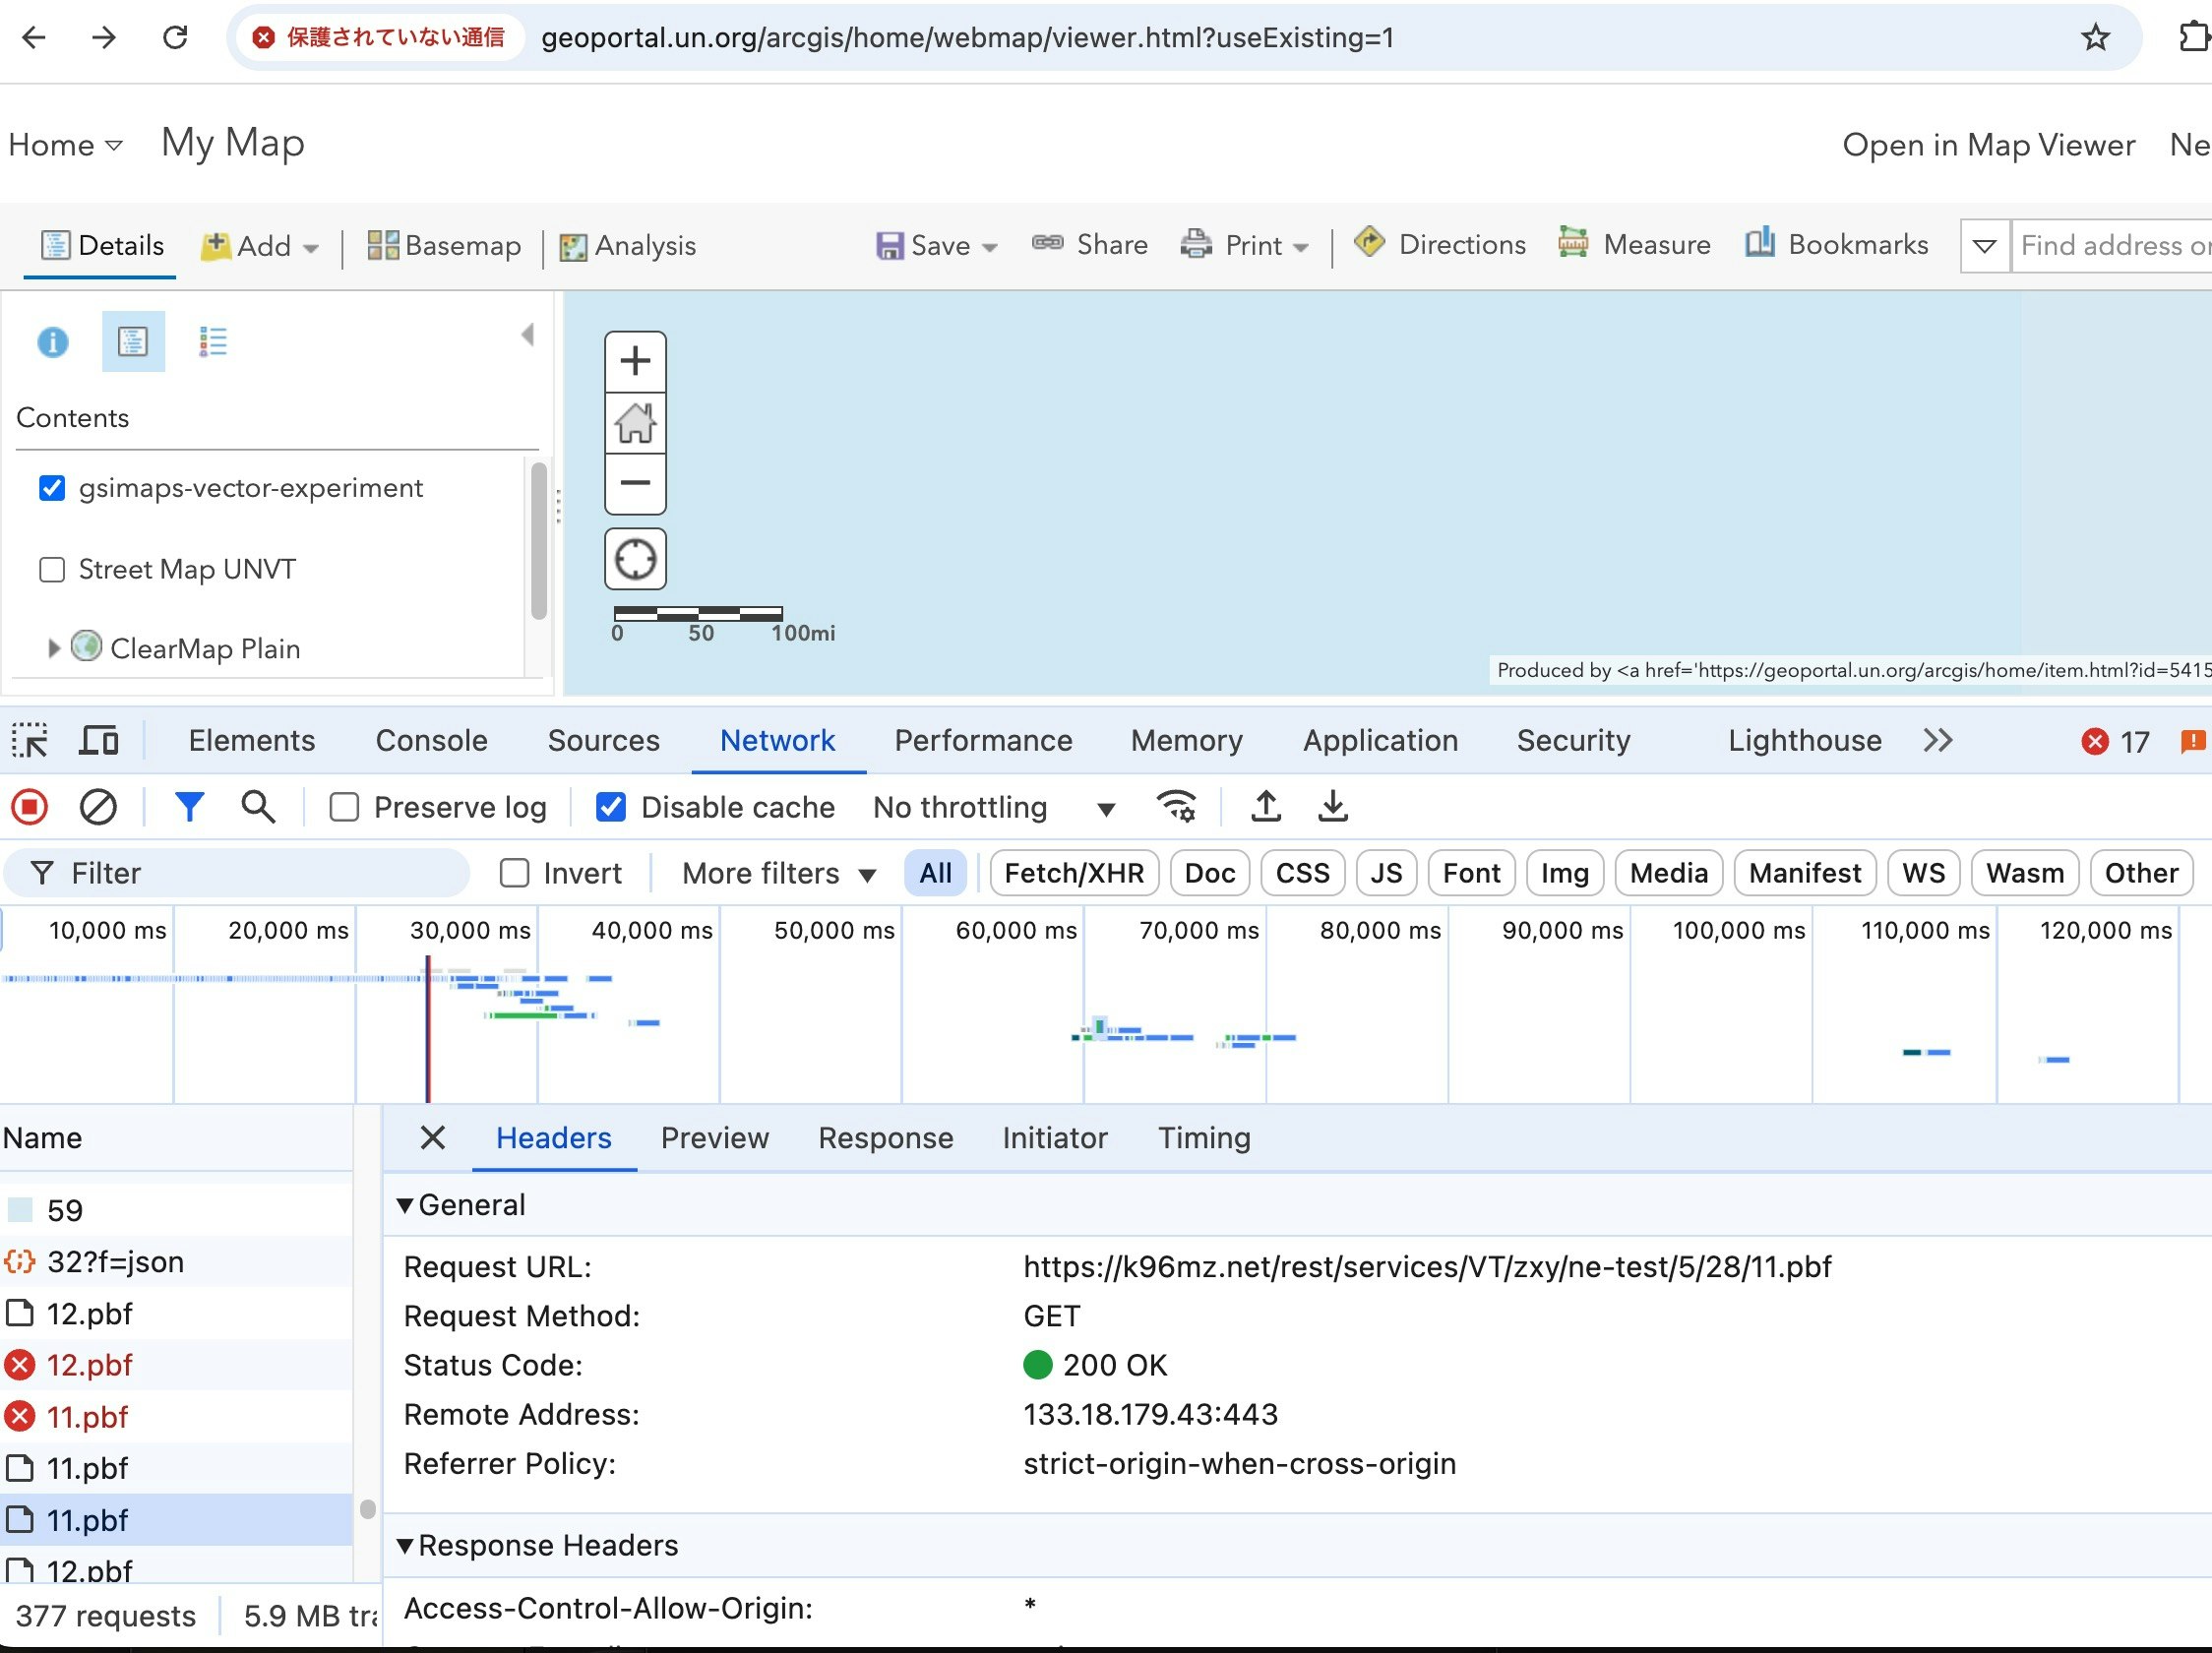
使用したmbtilesとスタイルファイルが適切に対応していないのかもしれません。
まとめ
ArcGISサーバ以外でホストしているベクトルタイルを、ArcGIS Onlineでホストするための練習をしました。ArcGIS Onlineでの読み込みがうまくいかない場合がありましたが、こちらの記事ではうまくいっているので、自身で再度ベクトルタイルをホストするときは問題なさそうです。
Reference