はじめに
こちらの記事でunvt/charitesを用いてベクトルタイルをスタイリングするための基本的な事項を記載しました。unvt/charitesの使用方法をさらに練習したいと思い、こちらの記事で解説されている方法を自分なりに実践してみたのが本記事になります。
環境
charites 0.5.4
macOS Sonoma: 14.6.1
node.js: v20.15.1
npm: 10.7.0
Exercise 2. スタイルの編集
元記事の「Exercise 1. unvt/charites のインストール」は飛ばしています。
2-1. 新しいスタイルをはじめから作る
元記事に記載の通り、git cloneとして必要なファイルをダウンロードしてきます。
git clone https://github.com/ubukawa/charites-init
ダウンロードすると、layersフォルダと、以下のようなstyle.ymlファイルが格納されました。layersフォルダには、レイヤの雛形が格納されています。
version: 8
#sprite: https://-------------/sprites/sprite
#glyphs: https://-------------/{fontstack}/{range}.pbf
sources:
  v: #change the name if needed
    type: vector
    #attribtuion: atttribution here   #add if needed
    #minzoom: 0 #add if needed
    #maxzoom: 5 #add if needed
    tiles:
    - https://--------/{z}/{x}/{y}.pbf
layers:
   - !!inc/file layers/background.yml
   # add any layer if needed
2-2. style.yml を編集して、sources, sprites, glyphs を指定する
元記事に記載の通り、コメントタグ(#)を削除して必要な事項を以下の方針で記入していきます。ファイルはstyle2.ymlとして新しくコピーしたものを使用します。
spriteとglyphsの参照先URLですが、以下のファイルのとおり記載しています。spriteについては、こちらの記事を参考にしてください。
sources
ここにデータソースを指定することができます。以下のYAMLファイルにあるように3つのベクトルタイルソースを指定します。
version: 8
sprite: https://ubukawa.github.io/clearmap-style2/sprite_un/sprite_S
glyphs: https://ubukawa.github.io/clearmap-style2/font/{fontstack}/{range}.pbf
sources:
  ne: #change the name if needed
    type: vector
    attribtuion: NaturalEarth #add if needed
    minzoom: 0 #add if needed
    maxzoom: 5 #add if needed
    tiles:
      - https://ubukawa.github.io/graticules-vt/zxy/{z}/{x}/{y}.pbf
  carto: #change the name if needed
    type: vector
    attribtuion: Cartotile - Test data #add if needed
    minzoom: 0 #add if needed
    maxzoom: 2 #add if needed
    tiles:
      - https://ubukawa.github.io/cartotile/tile/{z}/{x}/{y}.pbf
  cme: #change the name if needed
    type: vector
    attribtuion: UN_CLEARMAP_VT(powered by esri) #add if needed
    minzoom: 0 #add if needed
    maxzoom: 5 #add if needed
    tiles:
      - https://pro-ags2.dfs.un.org/arcgis/rest/services/Hosted/Clearmap_Webplain/VectorTileServer/tile/{z}/{y}/{x}.pbf
layers:
  - !!inc/file layers/background.yml
  # add any layer if needed
2-3. charites ライブプレビュー開始
次にcharitesでライブプレビューを立ち上げます。以下のコマンドを実行します。
charites serve style2.yml
現時点では、レイヤのスタイルファイルがbackgroundしかないので、背景しか表示されていません。

2-4. background color の変更の練習
下記のようにbackgroundの値を変更してみました。
id: background
type: background
paint:
  # background-color: '#D6EBF5'
  background-color: rgb(200, 200, 200)
そうすると、以下のように背景の色が変更されました。

2-5. レイヤ(layer)を足してみよう: グリッドライン(緯度経度の線)
charites ライブプレビューを実行したまま作業を続けます。次にNaturalEarthの30度の経緯度線を足してみます。style.yml中ではneとしたソースです。編集を簡単にするため用意された、charites-init/layers/layer_samples/ls-line-sample.ymlというサンプルYAMLファイルを使います。"ls-line-sample.yml" を "ls-grid30.yml" としてコピーして、それを編集します。
charites ライブプレビューが走ったままなので、新しいターミナルを立ち上げて作業します。
cd charites-init/layers
cp layer_samples/ls-line-sample.yml ls-grid30.yml
"ls-grid30.yml" を以下のように編集します。
id: ls-grid30
minzoom: 0
maxzoom: 5
paint:
  line-color: "#999999"
  line-width: 0.7
source: ne
source-layer: grid30
type: line
このままではライブプレビューには変化が見られません。なぜなら、style2.ymlに該当レイヤを追加していないからです。以下のように1行追加します。レイヤのリストの中では、下に来るレイヤほどウェブ地図上では上に来ます。
version: 8
sprite: https://ubukawa.github.io/clearmap-style2/sprite_un/sprite_S
glyphs: https://ubukawa.github.io/clearmap-style2/font/{fontstack}/{range}.pbf
sources:
  ne: #change the name if needed
    type: vector
    attribtuion: NaturalEarth #add if needed
    minzoom: 0 #add if needed
    maxzoom: 5 #add if needed
    tiles:
      - https://ubukawa.github.io/graticules-vt/zxy/{z}/{x}/{y}.pbf
  carto: #change the name if needed
    type: vector
    attribtuion: Cartotile - Test data #add if needed
    minzoom: 0 #add if needed
    maxzoom: 2 #add if needed
    tiles:
      - https://ubukawa.github.io/cartotile/tile/{z}/{x}/{y}.pbf
  cme: #change the name if needed
    type: vector
    attribtuion: UN_CLEARMAP_VT(powered by esri) #add if needed
    minzoom: 0 #add if needed
    maxzoom: 5 #add if needed
    tiles:
      - https://pro-ags2.dfs.un.org/arcgis/rest/services/Hosted/Clearmap_Webplain/VectorTileServer/tile/{z}/{y}/{x}.pbf
layers:
  - !!inc/file layers/background.yml
  - !!inc/file layers/ls-grid30.yml
  # add any layer if needed
こうすることで、経緯度線が以下のように表示されました。
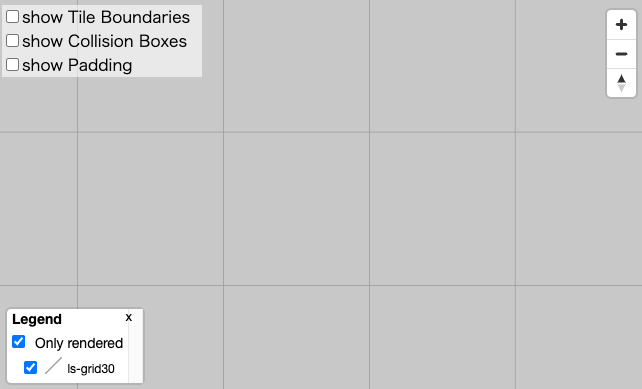
ここで、ベクトルタイルのデータとしてはズームレベルが1~5で作成されていたため、ls-grid30.ymlにおいてズームレベルを0~5としていたとしても、0~1においては経緯度線が表示されないことに注意しましょう。ベクトルタイルのズームレベルの設定は複数存在してややこしいので、また別の機会にまとめようと思います。
2-6. レイヤを足してみよう: ポリゴン(Fill)を足す
次に、陸地のポリゴンを足してみます。同じように、テンプレートの "pg-fill-sample.yml" を "pg-landmass.yml" としてコピーして編集します。
cp layer_samples/pg-fill-sample.yml pg-landmass.yml
id: pg-landmass
minzoom: 0
maxzoom: 5
paint:
  fill-color: rgb(237,237,237)
source: carto
source-layer: bnda
type: fill
そして、style2.ymlにレイヤを追加します。追加する位置は、背景と経緯度線のレイヤの間です。
version: 8
sprite: https://ubukawa.github.io/clearmap-style2/sprite_un/sprite_S
glyphs: https://ubukawa.github.io/clearmap-style2/font/{fontstack}/{range}.pbf
sources:
  ne: #change the name if needed
    type: vector
    attribtuion: NaturalEarth #add if needed
    minzoom: 0 #add if needed
    maxzoom: 5 #add if needed
    tiles:
      - https://ubukawa.github.io/graticules-vt/zxy/{z}/{x}/{y}.pbf
  carto: #change the name if needed
    type: vector
    attribtuion: Cartotile - Test data #add if needed
    minzoom: 0 #add if needed
    maxzoom: 2 #add if needed
    tiles:
      - https://ubukawa.github.io/cartotile/tile/{z}/{x}/{y}.pbf
  cme: #change the name if needed
    type: vector
    attribtuion: UN_CLEARMAP_VT(powered by esri) #add if needed
    minzoom: 0 #add if needed
    maxzoom: 5 #add if needed
    tiles:
      - https://pro-ags2.dfs.un.org/arcgis/rest/services/Hosted/Clearmap_Webplain/VectorTileServer/tile/{z}/{y}/{x}.pbf
layers:
  - !!inc/file layers/background.yml
  - !!inc/file layers/pg-landmass.yml
  - !!inc/file layers/ls-grid30.yml
  # add any layer if needed
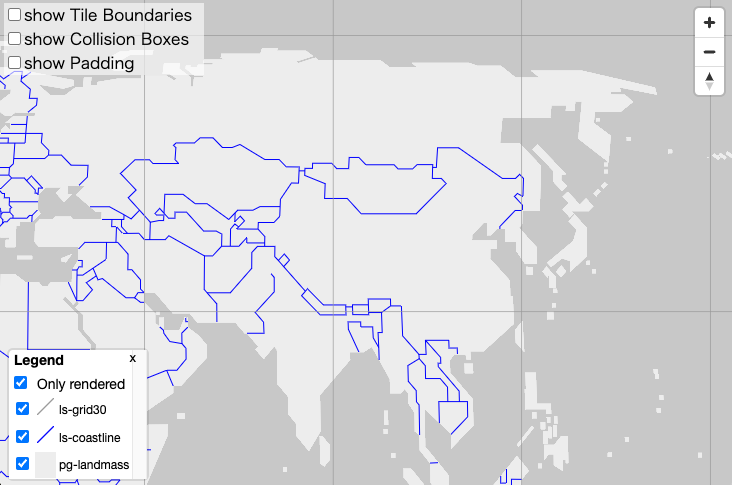
そうすると、以下のような地図が見られます。

2-7. レイヤを足してみよう: もう一つのラインレイヤを "filter"を使って加える
次に、もう一つのラインを足してみます。ライン用のテンプレートを"ls-coastline.yml"としてコピーして、以下のように編集します。style2.ymlにもレイヤを追加しておきます。
filter:
  - "=="
  - - get
    - bdytyp
  - 0
id: ls-coastline
minzoom: 0
maxzoom: 5
paint:
  line-color: "#0000FF"
  line-width: 1
source: carto
source-layer: bndl
type: line
ここではfilterを使用しています。filterの部分は、JSONファイルに変換した場合には、以下のように記載されます。
"filter": ["==", ["get", "bdytyp"], 0]
ちなみにMaputnikで記載した場合には、以下のようなallがつきます。
"filter": ["all", ["==", "bdytyp", 0]]
Maputnikで記載した場合については、こちらの記事に記載があります。スタイルのExpressionについては、奥が深そうなので、もう少し進んだら別記事でまとめようと思います。
以下のような地図が見られます。

ちなみに、bdytypが0ではなく1とすると、以下のような地図が見られます。指定する属性の値によって、表示する地物が異なっているのが分かります。
2-8. レイヤを足してみよう: symbolをたす (filter と matchを使う)
最後にシンボルのレイヤも試してみます。
テンプレート(pt-symbol-sample.yml) を "pt-city.yml" としてコピーします。そして以下のように編集します。
filter:
  - match
  - - get
    - _symbol
  - - 0
    - 1 #Alternative
    - 2 #territorial
  - true
  - false
id: pt-city
minzoom: 4
maxzoom: 5
layout:
  icon-allow-overlap: true
  icon-image:
    - match
    - - get
      - _symbol
    - 1
    - PPL_Alternative
    - 2
    - PPL_Territorial
    - PPL_National # for _symbol==0
  icon-size: 1
  text-allow-overlap: true
  text-optional: true
  text-field: "{_symbol}" #or [get, text_field] would be good.
  text-font:
    - Open Sans Regular #text font should be from glyphs
  text-size: 10
  text-anchor: bottom
  text-offset:
    - 1
    - 1
  #text-letter-spacing: 0.1
  #text-max-width: 50
paint:
  text-color: "#000000"
  text-halo-color: "#FFFFFF"
  text-halo-width: 0.8
source: cme
source-layer: Populated Places_SYMBOLS #polygon or line can be also used for labelling
type: symbol
編集が終わったらstyle.ymlにレイヤを追加します。グリッドラインと海岸線ラインの間に入れましょう。
layers:
  - !!inc/file layers/background.yml
  - !!inc/file layers/pg-landmass.yml
  - !!inc/file layers/ls-coastline.yml
  - !!inc/file layers/pt-city.yml
  - !!inc/file layers/ls-grid30.yml
以下のような地図が表示されます。左下の方に2とあり、ここのアイコンだけ形が微妙に異なっているのが分かります。

元記事に解説があります。私の場合は、まだsymbolに慣れていないので、自分でベクトルタイルを作ってみてスタイリングをまたの機会に試したいと思います。
Exercise 3. YAMLファイルからJSONファイルへの出力
最後にYAMLファイルからJSONファイルへの出力を行います。以下のコマンドを実行することで、style2.ymlからstyle2.jsonを作成することが出来ます。
charites build style2.yml style2.json
こちらから作成した地図が見られます。シンボルは、スタイルファイルで設定したように、ズームレベル4〜5の間でしか見られないことに注意してください。スタイルファイルのURLは以下の通りです。
https://k96mz.github.io/charites-init-/style2.json
まとめ
unvt/charitesでベクトルタイル地図のスタイル作成練習をしました。元記事を作成されたT-ubuさんに感謝します。
Reference