概要
自動車の属性データからガソリン1ガロンあたりの走行距離を予測するモデル作成を行います。
データはこちらからダウンロードしてください。
他にも「Learn Python In Seminar」のシリーズとして書いているので、よければご覧ください!
利用するデータの説明
| カラム | ヘッダ名称 | データ型 | 説明 |
|---|---|---|---|
| 1 | mpg | float | ガソリン1ガロンあたりの走行距離 |
| 2 | cylinders | varchar | シリンダー |
| 3 | displacement | float | 排気量 |
| 4 | horsepower | float | 馬力 |
| 5 | weight | float | 重量 |
| 6 | acceleration | float | 加速度 |
| 7 | model year | varchar | 年式 |
| 8 | origin | varchar | 起源 |
| 9 | car name | varchar | 車名 |
ライブラリのインストール
import numpy as np
import pandas as pd
import seaborn as sns
from matplotlib import pyplot as plt
from sklearn.metrics import r2_score
from sklearn.model_selection import train_test_split
from sklearn.metrics import mean_squared_error as MSE
from sklearn.linear_model import LinearRegression as LR
データの読み込み
df_train = pd.read_csv('data/train.tsv', sep='\t')

print(df_train.head())
↓
   id   mpg  cylinders  displacement horsepower  weight  acceleration  model year  origin          car name
0   0  29.0          4         135.0      84.00  2525.0          16.0          82       1    dodge aries se
1   3  31.9          4          89.0      71.00  1925.0          14.0          79       2  vw rabbit custom
2   9  19.0          6         156.0      108.0  2930.0          15.5          76       3    toyota mark ii
3  11  28.0          4          90.0      75.00  2125.0          14.5          74       1        dodge colt
4  13  37.7          4          89.0      62.00  2050.0          17.3          81       3     toyota tercel
欠損値の確認
print(df_train.isnull().sum())
↓
id              0
mpg             0
cylinders       0
displacement    0
horsepower      0
weight          0
acceleration    0
model year      0
origin          0
car name        0
dtype: int64
基本統計量
print(df_train.describe(include='all'))
↓
                id         mpg   cylinders  displacement horsepower       weight  acceleration  model year      origin    car name
count   199.000000  199.000000  199.000000    199.000000        199   199.000000    199.000000  199.000000  199.000000         199
unique         NaN         NaN         NaN           NaN         71          NaN           NaN         NaN         NaN         167
top            NaN         NaN         NaN           NaN      90.00          NaN           NaN         NaN         NaN  ford pinto
freq           NaN         NaN         NaN           NaN         12          NaN           NaN         NaN         NaN           4
mean    200.170854   24.307035    5.296482    183.311558        NaN  2883.839196     15.647739   76.165829    1.582915         NaN
std     113.432759    7.797665    1.644562     98.400457        NaN   819.766870      2.701885    3.802928    0.798932         NaN
min       0.000000    9.000000    3.000000     71.000000        NaN  1613.000000      8.500000   70.000000    1.000000         NaN
25%      98.500000   18.000000    4.000000     98.000000        NaN  2217.500000     14.000000   73.000000    1.000000         NaN
50%     202.000000   24.000000    4.000000    140.000000        NaN  2702.000000     15.500000   76.000000    1.000000         NaN
75%     294.500000   30.500000    6.000000    250.000000        NaN  3426.500000     17.150000   80.000000    2.000000         NaN
max     396.000000   44.600000    8.000000    454.000000        NaN  5140.000000     23.700000   82.000000    3.000000         NaN
相関係数
print(df_train.corr())
↓
                    id       mpg  cylinders  displacement    weight  acceleration  model year    origin
id            1.000000 -0.052688   0.103419      0.098416  0.070563     -0.087649   -0.093272 -0.031421
mpg          -0.052688  1.000000  -0.770160     -0.804635 -0.820660      0.379721    0.568471  0.533671
cylinders     0.103419 -0.770160   1.000000      0.950600  0.893256     -0.479561   -0.303462 -0.497373
displacement  0.098416 -0.804635   0.950600      1.000000  0.933038     -0.523955   -0.329817 -0.579805
weight        0.070563 -0.820660   0.893256      0.933038  1.000000     -0.401757   -0.265562 -0.535893
acceleration -0.087649  0.379721  -0.479561     -0.523955 -0.401757      1.000000    0.194854  0.189193
model year   -0.093272  0.568471  -0.303462     -0.329817 -0.265562      0.194854    1.000000  0.124279
origin       -0.031421  0.533671  -0.497373     -0.579805 -0.535893      0.189193    0.124279  1.000000
相関係数の可視化
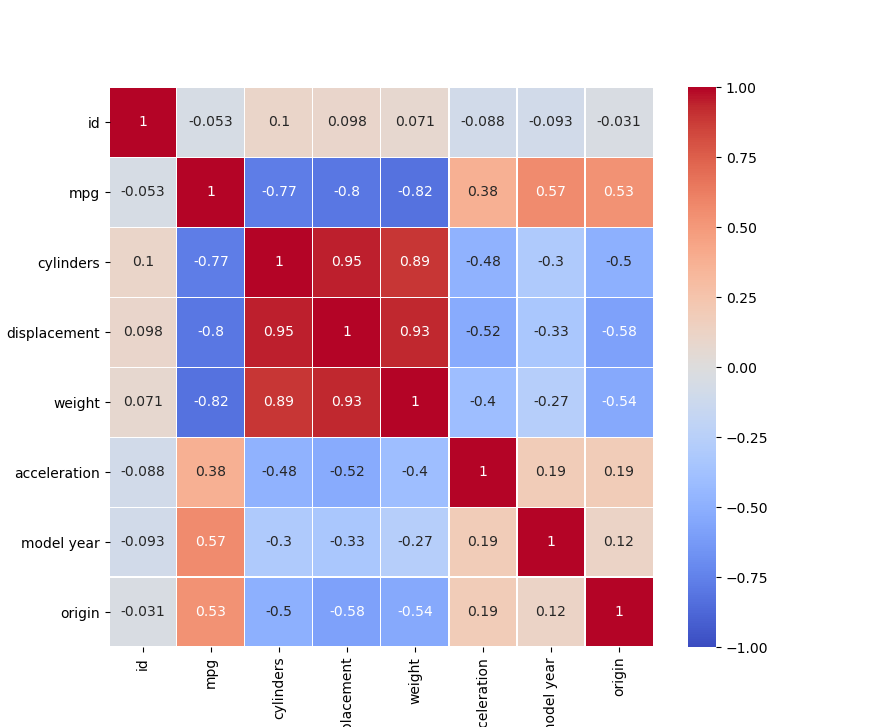
- mpg(ガロンあたりの走行距離)とdisplacement、weightに強い負の相関関係
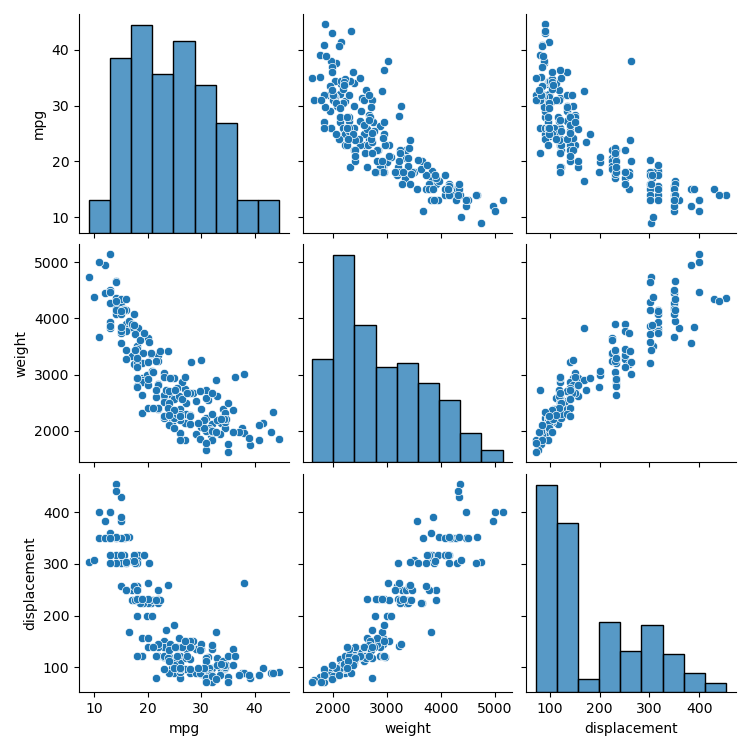
相関関係の可視化
sns.pairplot(df_train[["mpg", "weight", "displacement"]])
↓
重回帰モデルの作成
# データの準備
y_train = df_train[["mpg"]] # 被説明変数
X_train = df_train[["weight", "displacement"]] # 説明変数

# モデルの生成
lr = LR()

# モデルの学習
lr.fit(X_train, y_train)
学習結果
print(lr.coef_) # 傾き
print(lr.intercept_) # 切片
print(lr.score(X_train, y_train)) # 決定係数
↓
[[-0.00513703 - 0.02383218]] # 傾き
[43.4901176] # 切片
0.6851901992035567 # 決定係数
- y = b1 × -0.00513703 + b2 × -0.02383218 + 43.4901176
学習結果と実データの比較
df_train['pred'] = y_pred_train

# 実データと予測結果の差をresとして代入
df_train['res'] = df_train['mpg'] - df_train['pred']

# ソート
print(df_train.sort_values(by='res'))
↓
mpg   displacement  weight  model year                            car name       pred        res
19.0         122.0  2310.0          73                          ford pinto  28.716052 - 9.716052
20.0         140.0  2408.0          72                      chevrolet vega  27.783644 - 7.783644
18.0         121.0  2933.0          72                     volvo 145e(sw)  25.539515 - 7.539515
19.0         121.0  2868.0          73                         volvo 144ea  25.873422 - 6.873422
21.0         140.0  2401.0          73                      chevrolet vega  27.819603 - 6.819603
...           ...     ...         ...                                 ...        ...        ...
41.5          98.0  2144.0          80                           vw rabbit  30.140772  11.359228
43.1          90.0  1985.0          78     volkswagen rabbit custom diesel  31.148217  11.951783
44.6          91.0  1850.0          80                 honda civic 1500 gl  31.817884  12.782116
43.4          90.0  2335.0          80                  vw dasher(diesel)  29.350257  14.049743
38.0         262.0  3015.0          82   oldsmobile cutlass ciera(diesel)  21.757941  16.242059
- model yearが古い時にマイナス、新しい時にプラスにずれている
- すでにmodel yearとmpgに相関関係が確認
特徴量の追加
説明変数にmodel yearを追加
y_train = df_train[["mpg"]]
X_train = df_train[["weight", "displacement", "model year"]]


lr = LR()
lr.fit(X_train, y_train)
y_pred_train = lr.predict(X_train)

print(lr.score(X_train, y_train))
↓
0.806202914350324
- model yearを説明変数に設定したところ決定変数の値が約0.2上昇
再検証
df_train['pred'] = y_pred_train
df_train['res'] = df_train['mpg'] - df_train['pred']
print(df_train.sort_values(by='res'))
↓
mpg  displacement  weight  model year                           car name       pred        res
19.0         122.0  2310.0          73                         ford pinto  25.822268 - 6.822268
22.0         232.0  2835.0          82                     ford granada l  28.804316 - 6.804316
19.8         200.0  2990.0          79                   mercury zephyr 6  25.711137 - 5.911137
21.5         121.0  2600.0          77                           bmw 320i  27.049786 - 5.549786
23.5         173.0  2725.0          81                 chevrolet citation  29.040204 - 5.540204
 ...           ...     ...         ...                                ...        ...        ...
36.4         121.0  2950.0          80                audi 5000s(diesel)  27.133402   9.266598
44.6          91.0  1850.0          80                honda civic 1500 gl  34.205448  10.394552
38.0         262.0  3015.0          82  oldsmobile cutlass ciera(diesel)  27.517075  10.482925
43.1          90.0  1985.0          78    volkswagen rabbit custom diesel  31.838867  11.261133
43.4          90.0  2335.0          80                 vw dasher(diesel)  31.161030  12.238970
- 通常年式だけではなく、車の種類とセットのため、car nameもセットで関係していると予測
ダミー変数化
ダミー変数化できるカラムを自動で認識
X_train = pd.get_dummies(
    df_train[["weight", "displacement", "model year", "car name"]])
print(X_train)
↓
weight  displacement  model year  ...  car name_vw dasher(diesel)  car name_vw rabbit  car name_vw rabbit custom
2525.0         135.0          82  ...                            0                   0                    0
1925.0          89.0          79  ...                            0                   0                    1
2930.0         156.0          76  ...                            0                   0                    0
2125.0          90.0          74  ...                            0                   0                    0
2050.0          89.0          81  ...                            0                   0                    0
...           ...         ...  ...                          ...                 ...                  ...
2110.0          85.0          80  ...                            0                   0                    0
3570.0         302.0          78  ...                            0                   0                    0
3433.0         304.0          70  ...                            0                   0                    0
2335.0          90.0          80  ...                            1                   0                    0
2265.0          98.0          73  ...                            0                   0                    0
再度モデルの作成と検証
y_train = df_train[["mpg"]]
X_train = pd.get_dummies(
    df_train[["weight", "displacement", "model year", "car name"]])

lr = LR()
lr.fit(X_train, y_train)
y_pred_train = lr.predict(X_train)

df_train['pred'] = y_pred_train
df_train['res'] = df_train['mpg'] - df_train['pred']
print(df_train.sort_values(by='res'))

print(lr.score(X_train, y_train))
↓
mpg  displacement  weight  model year            car name       pred       res
29.0          90.0  1937.0          76           vw rabbit  34.656354 - 5.656354
31.8          85.0  2020.0          79          datsun 210  36.276274 - 4.476274
19.0         122.0  2310.0          73          ford pinto  23.364118 - 4.364118
25.0         116.0  2220.0          76           opel 1900  27.625883 - 2.625883
23.5         173.0  2725.0          81  chevrolet citation  26.067394 - 2.567394
 ...           ...     ...         ...                 ...        ...       ...
28.0         116.0  2123.0          71           opel 1900  25.374117  2.625883
26.5         140.0  2565.0          76          ford pinto  23.871847  2.628153
30.5          97.0  2190.0          77   volkswagen dasher  27.862259  2.637741
40.8          85.0  2110.0          80          datsun 210  36.323726  4.476274
41.5          98.0  2144.0          80           vw rabbit  35.843646  5.656354

0.9834170393004322
- 予測データと実データの差が減少
- car nameのダミー変数化前に比べて決定係数が約0.3上昇
結果
- horsepower、weight、model yearに自動車の走行距離(mpg)に影響
- car nameをダミー変数化することで決定係数が大幅に改善
課題
- car nameを説明変数に入れると未知の車種を予測できなかった(過学習)
→メーカーと車種を分けて分析する必要がある - originやcylindersが未検証
- null以外の欠損値があとで発見