本記事について
本記事では、JavaのProfilierであるVisualVMの基本的な使い方について記す。
Java VisualVMとは
Java VisualVMはJavaのProfiling Toolである。公式サイトによる説明は以下の通り。Pluginによって機能拡張も可能なようである。
Java VisualVMは、指定されたJava仮想マシン(JVM)でJavaテクノロジベースのアプリケーション(Javaアプリケーション)が実行されているときに、そのJavaアプリケーションに関する詳細な情報を提供する直感的なグラフィカル・ユーザー・インタフェースです。
Java VisualVMは、Javaアプリケーションの開発者がアプリケーションのトラブルシューティングを行なったり、アプリケーションのパフォーマンスをモニターおよび改善したりするのに役立ちます。Java VisualVMを使用すると、開発者はヒープ・ダンプの生成および解析、メモリー・リークの特定、ガベージ・コレクションの実行およびモニタリング、およびメモリーとCPUの簡易プロファイリングの実行が可能になります。
Installと起動 (ubuntu)
ubuntuの場合インストールはapt-get一発。インストールが終わったら visualvmで起動
$ apt-cache search visualvm
libvisualvm-jni - All-in-One Java Troubleshooting Tool (JNI libraries)
visualvm - All-in-One Java Troubleshooting Tool
$ sudo apt-get install visualvm
...
$ visualvm
Java VisualVM画面
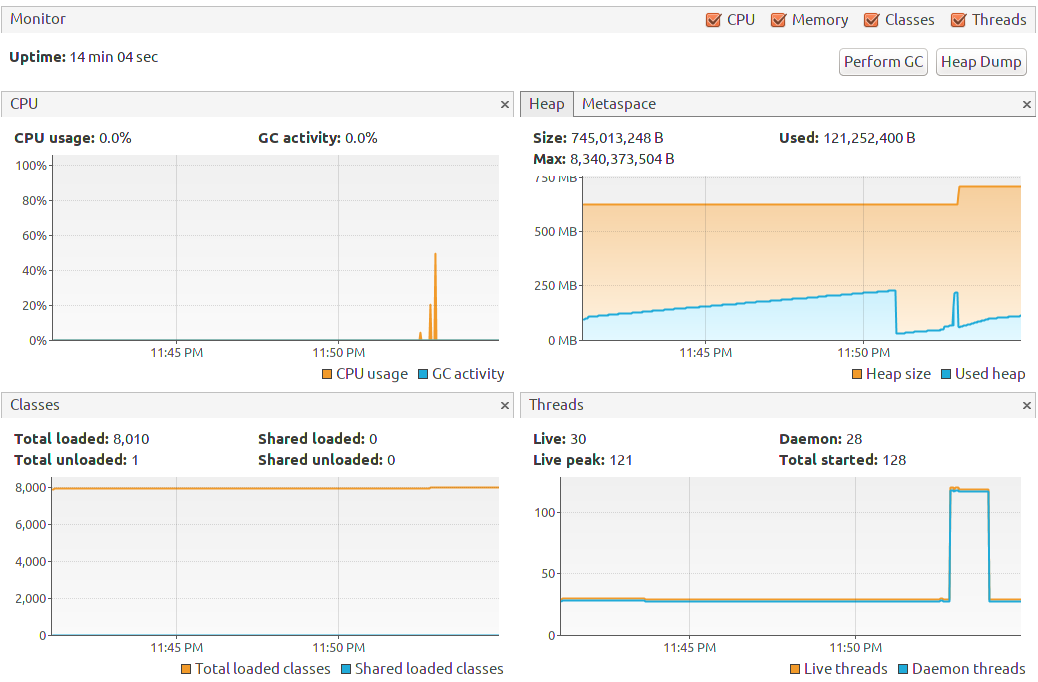
Monitor画面
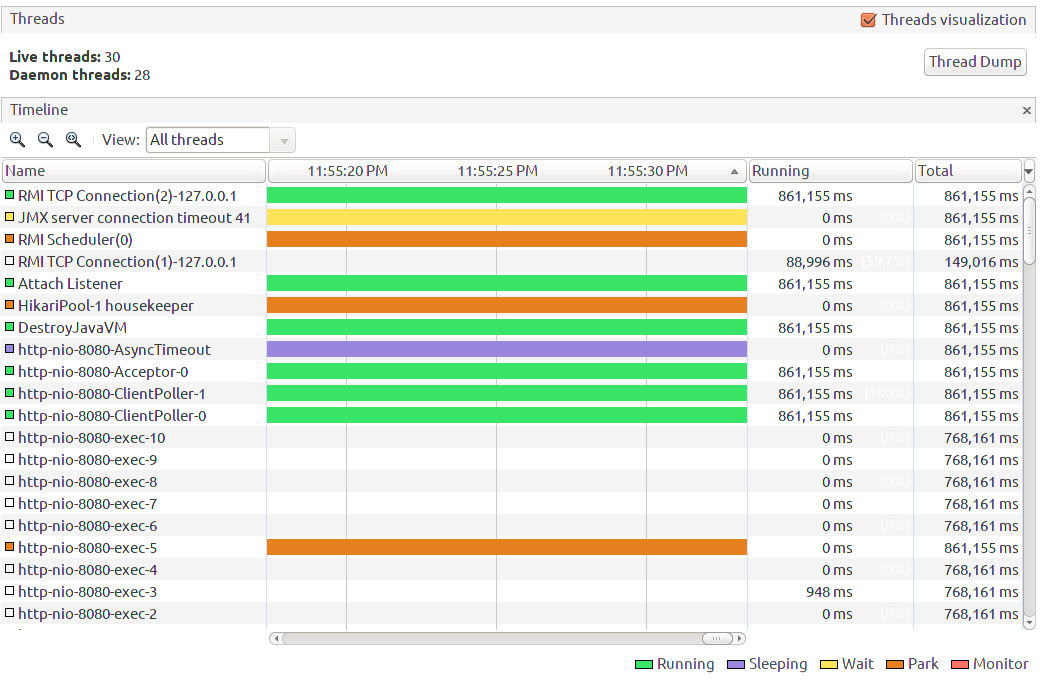
Threads画面
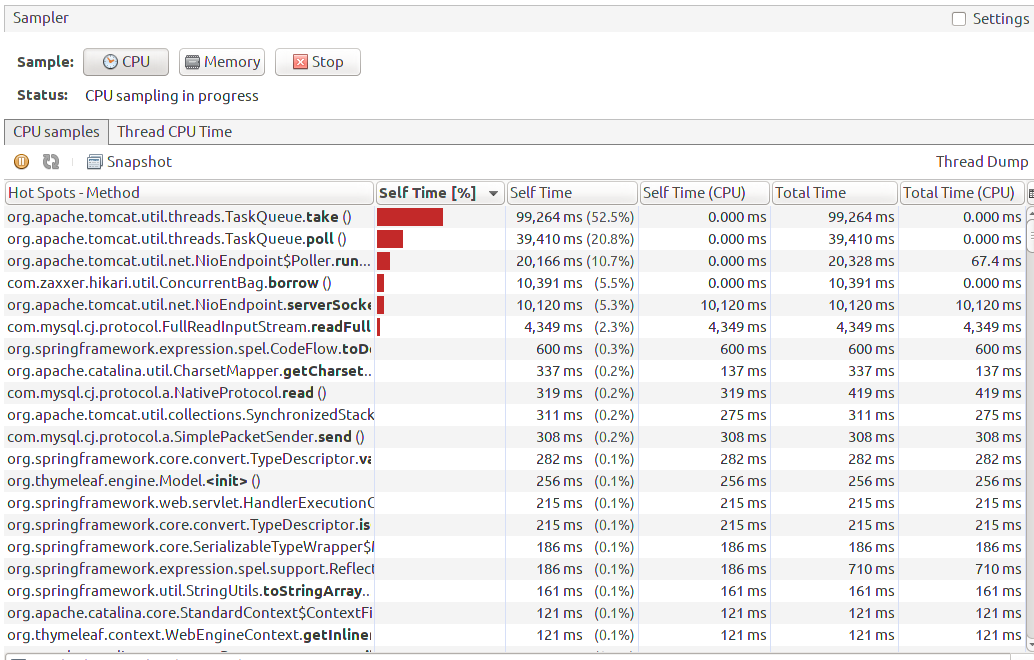
CPU Sampler
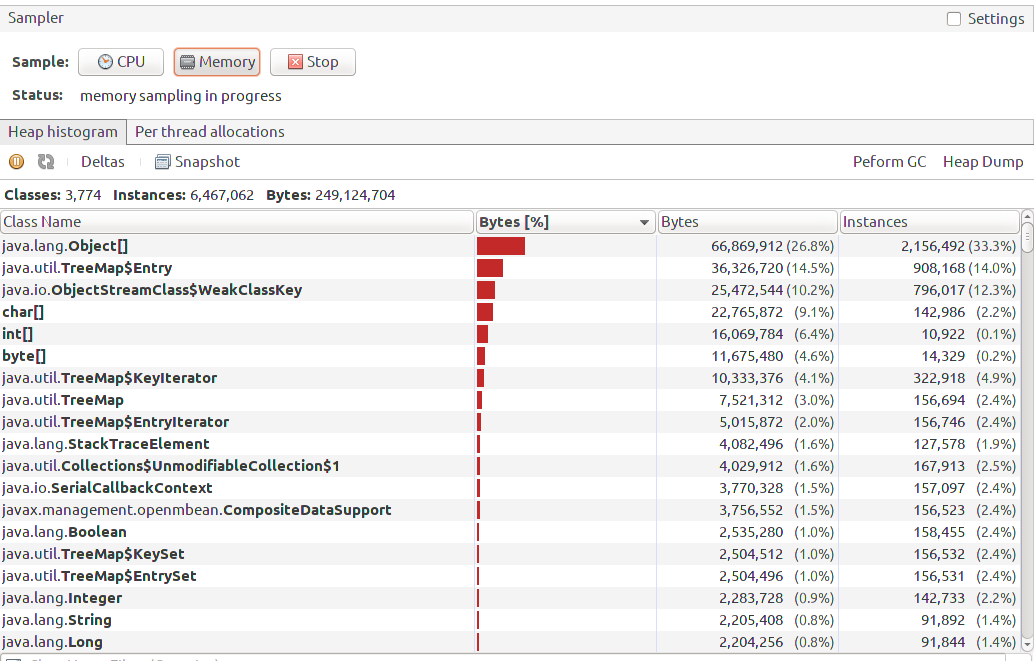
Memory Sampler
CPU Profiler
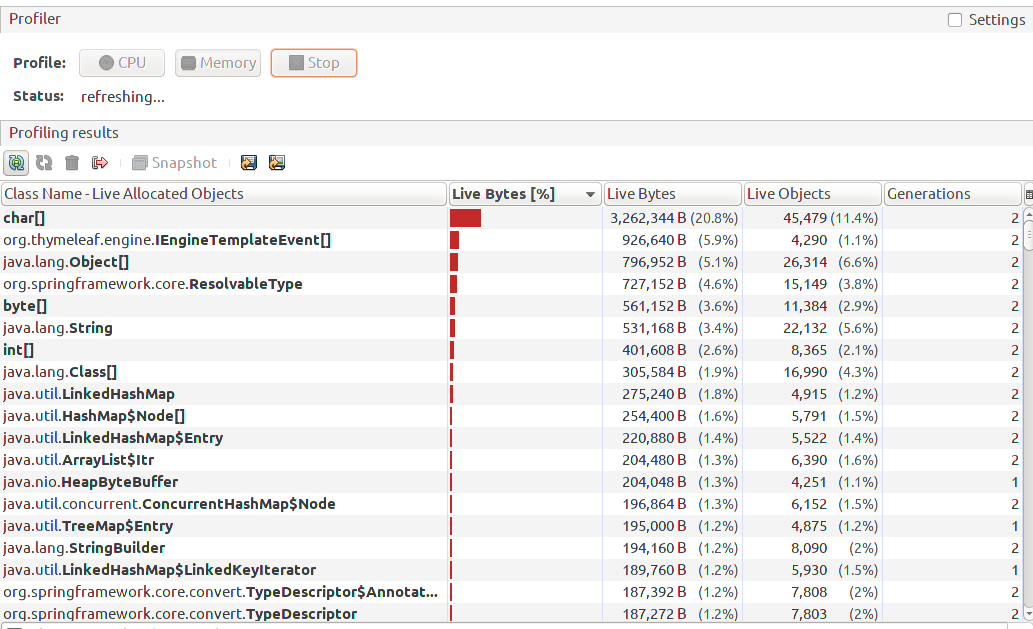
Memory Profiler
Profile/Sample結果の出力
一通りの可視化はVisualVM上で可能である。一方でさらに詳細な解析や他の可視化をしたい場合にはそのデータのみを抜き出したくなる。そのための仕組みもVisualVMは提供している。
Export Profile Result
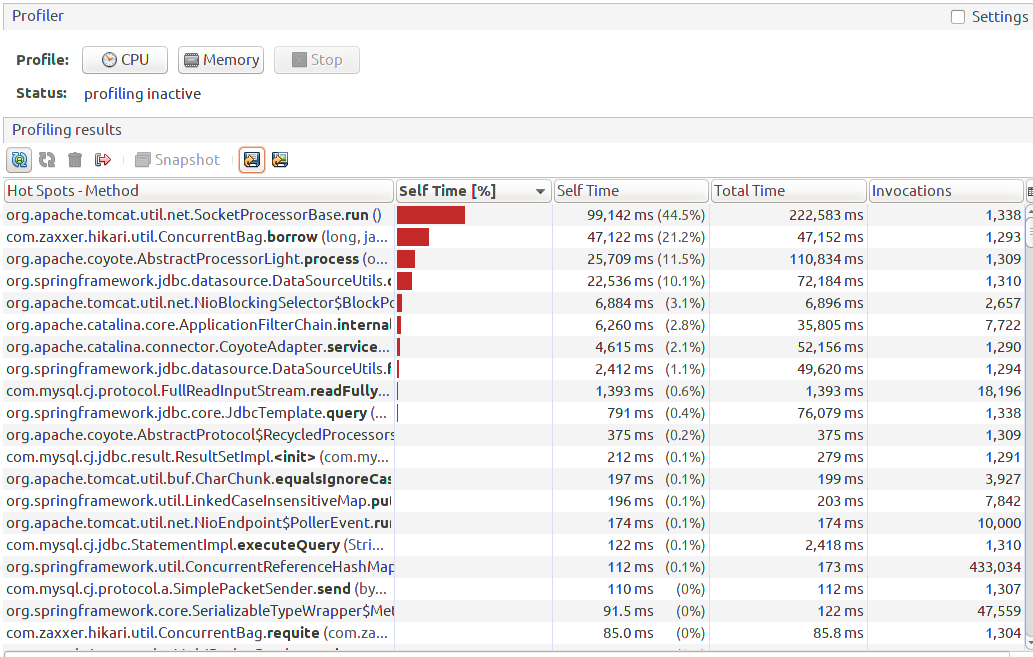
Profilerにて実行 -> Stopの結果を出力する。xml, html, csvなどの形式で出力できる。以下にcsvの例を示す。Methodごと1行で, Self Time, Total Time, Invocationsの形で整形されて出力される。楽である。(本記事書くまで知らんかった...
"Hot Spots - Method","Self Time [%]","Self Time","Total Time","Invocations"
"org.apache.tomcat.util.net.SocketProcessorBase.run()","44.50689","99142.459 ms","222583.639 ms","1338"
"com.zaxxer.hikari.util.ConcurrentBag.borrow(long, java.util.concurrent.TimeUnit)","21.153963","47122.053 ms","47152.68 ms","1293"
"org.apache.coyote.AbstractProcessorLight.process(org.apache.tomcat.util.net.SocketWrapperBase, org.apache.tomcat.util.net.SocketEvent)","11.541287","25709.091 ms","110834.896 ms","1309"
"org.springframework.jdbc.datasource.DataSourceUtils.doGetConnection(javax.sql.DataSource)","10.117057","22536.51 ms","72184.265 ms","1310"
"org.apache.tomcat.util.net.NioBlockingSelector$BlockPoller.remove(org.apache.tomcat.util.net.NioEndpoint.NioSocketWrapper, int)","3.0905285","6884.386 ms","6896.103 ms","2657"
"org.apache.catalina.core.ApplicationFilterChain.internalDoFilter(javax.servlet.ServletRequest, javax.servlet.ServletResponse)","2.8102305","6260.001 ms","35805.26 ms","7722"
"org.apache.catalina.connector.CoyoteAdapter.service(org.apache.coyote.Request, org.apache.coyote.Response)","2.0718734","4615.255 ms","52156.903 ms","1290"
Export Snapshot
Profiling途中, Sampling中にSnapshotボタンによってSnapshotを取得することができる。その結果を、Profiler Snapshot File (nps), xml, html, csv形式で出力できる。以下にcsvの例を示す。先頭の空白がCall Treeの深さを表すcsv fileとしてexportされる。Columnとして、Total Timeことから、Sub TreeのMethodの実行時間を含んだ値が記される。また、子の中でSelf timeとある行がその親自身の実行時間(Self time), Invocation回数である。このcsvを頭からParseして、各MethodのTotalのself time, invocationsとして集計したものが、上記 Export Profile Resultに相当する。
"Call Tree - Method","Total Time [%]","Total Time","Invocations",
" All threads","0.0","0","0"
"  HikariPool-1 connection adder","100.0","18030427","1"
"   java.util.concurrent.ThreadPoolExecutor$Worker.run()","100.0","18030427","1"
"    Self time","99.29557","17903416","1"
"    java.util.concurrent.FutureTask.run()","0.70442593","127011","6416"
"     com.zaxxer.hikari.pool.HikariPool$PoolEntryCreator.call()","0.52456886","94582","6416"
"      com.zaxxer.hikari.pool.HikariPool$PoolEntryCreator.call()","0.428692","77295","6416"
"       Self time","0.30533385","55053","6416"
"       com.zaxxer.hikari.pool.HikariPool$PoolEntryCreator.shouldCreateAnotherConnection()","0.123352595","22241","6416"
"        com.zaxxer.hikari.pool.HikariPool.getTotalConnections()","0.10495592","18924","6416"
"         Self time","0.08798461","15864","6416"
"         com.zaxxer.hikari.util.ConcurrentBag.size()","0.016965766","3059","6416"
"        Self time","0.01839668","3317","6416"
"      Self time","0.09587682","17287","6416"
"     Self time","0.17985153","32428","6416"
"  http-nio-8080-exec-200","100.0","10865782","1"
"   org.apache.tomcat.util.threads.TaskThread$WrappingRunnable.run()","100.0","10865783","1"
"    java.util.concurrent.ThreadPoolExecutor$Worker.run()","99.99997","10865779","1"
"     org.apache.tomcat.util.net.SocketProcessorBase.run()","97.8199","10628897","14"
(参考) Sampling/Profiling負荷など
ここで用いているJava ProcessはSpring Bootで起動したWeb+DBアプリである。よって大量のRequestを投げ込むことでその負荷を上げることができる。ここでは、その応答時間からProfilingの影響を示す。
Basic performance
まずはSampling, Profilingをしない場合の性能 15,500 req/sec
$ ab -c 100 -n 10000 http://localhost:8080/
...
Concurrency Level:      100
Time taken for tests:   0.643 seconds
Complete requests:      10000
Failed requests:        0
Total transferred:      5020000 bytes
HTML transferred:       3650000 bytes
Requests per second:    15558.12 [#/sec] (mean)
Time per request:       6.428 [ms] (mean)
Time per request:       0.064 [ms] (mean, across all concurrent requests)
Transfer rate:          7627.13 [Kbytes/sec] received

Connection Times (ms)
              min  mean[+/-sd] median   max
Connect:        0    1   0.6      0       3
Processing:     1    6   2.7      5      27
Waiting:        1    5   2.7      5      27
Total:          1    6   2.6      6      27
WARNING: The median and mean for the initial connection time are not within a normal deviation
        These results are probably not that reliable.

Percentage of the requests served within a certain time (ms)
  50%      6
  66%      7
  75%      7
  80%      8
  90%     10
  95%     11
  98%     14
  99%     16
 100%     27 (longest request)
With Sampling
まずProfilingをせず、Samplingのみの場合のスループット性能 14,000 req/sec。多少の劣化が見られるものの、何もしない場合と比較しても遜色ない性能である。
$ ab -c 100 -n 10000 http://localhost:8080/
...
Concurrency Level:      100
Time taken for tests:   0.718 seconds
Complete requests:      10000
Failed requests:        0
Total transferred:      5020000 bytes
HTML transferred:       3650000 bytes
Requests per second:    13918.23 [#/sec] (mean)
Time per request:       7.185 [ms] (mean)
Time per request:       0.072 [ms] (mean, across all concurrent requests)
Transfer rate:          6823.20 [Kbytes/sec] received

Connection Times (ms)
              min  mean[+/-sd] median   max
Connect:        0    1   1.0      0       9
Processing:     1    6   3.1      6      30
Waiting:        1    6   3.1      5      29
Total:          1    7   3.2      7      31

Percentage of the requests served within a certain time (ms)
  50%      7
  66%      7
  75%      8
  80%      9
  90%     11
  95%     13
  98%     16
  99%     18
 100%     31 (longest request)
With Profiling
次にProfiling時のスループット性能 368 req/sec と大幅に劣化する。当たり前ですけれど、性能をリアルタイムに把握しつつも性能もある程度は欲しい、という場合には基本Sampling、という方針になる。
$ ab -c 100 -n 10000 http://localhost:8080/
...
Document Length:        365 bytes

Concurrency Level:      100
Time taken for tests:   27.130 seconds
Complete requests:      10000
Failed requests:        0
Total transferred:      5020000 bytes
HTML transferred:       3650000 bytes
Requests per second:    368.60 [#/sec] (mean)
Time per request:       271.299 [ms] (mean)
Time per request:       2.713 [ms] (mean, across all concurrent requests)
Transfer rate:          180.70 [Kbytes/sec] received

Connection Times (ms)
              min  mean[+/-sd] median   max
Connect:        0    1   1.3      0      13
Processing:     1  270 1248.8     40   23375
Waiting:        1  261 1202.5     37   23375
Total:          1  271 1248.7     41   23377

Percentage of the requests served within a certain time (ms)
  50%     41
  66%     94
  75%    121
  80%    153
  90%    304
  95%    722
  98%   3112
  99%   6118
 100%  23377 (longest request)
